Supported by Dr. Osamu Ogasawara and  . . |
|
Last data update: 2014.03.03 |
Plots for checking for unequal variancesDescriptionPlots for checking for unequal variances Usage
funnel(f,...)
## S3 method for class 'lm'
funnel(f,...)
## S3 method for class 'formula'
 funnel(f, data, subset, weights, na.action, method = "qr",
 model = TRUE, x = FALSE, y = FALSE, qr = TRUE, singular.ok = TRUE,
 contrasts = NULL, offset, ...)
Arguments
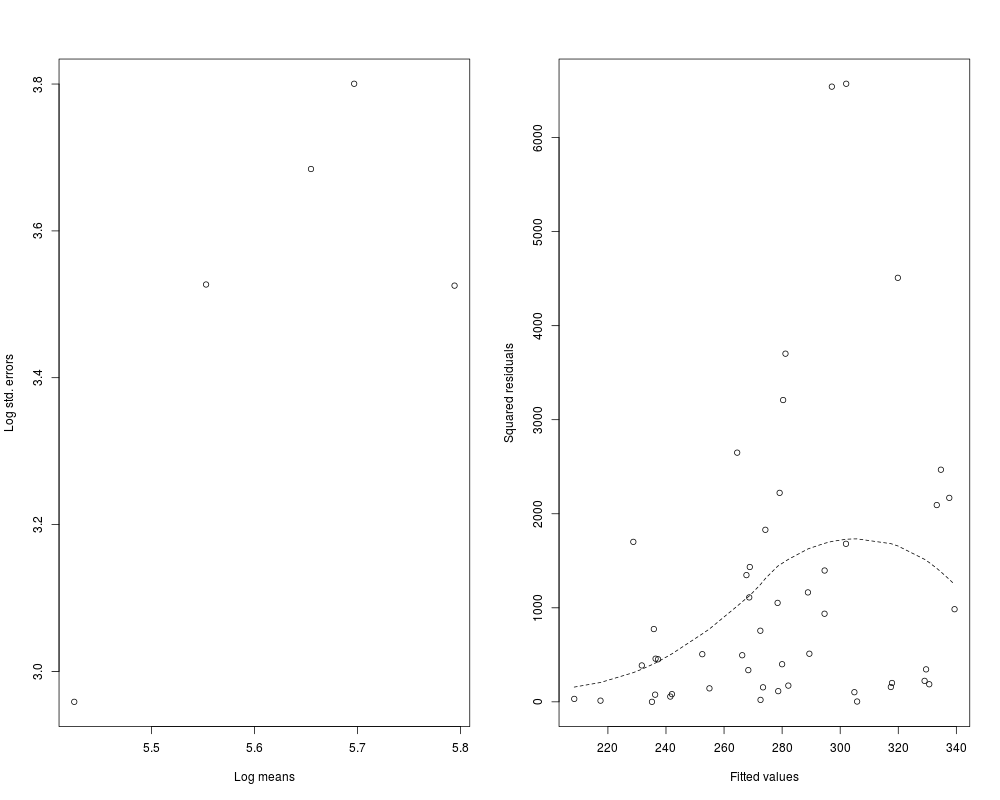
ValuePrints the slope of the line of best fit for log std.errors vs log means. Returns (invisibly) the estimated variances of the observations, and draws (i) a plot of log standard deviations versus log means, and (ii) a plot of the smoothed squared residuals. NoteThis function redirects to other functions based on the type of object. eg funnel.lm , funnel.formula Author(s)Alan Lee, Blair Robertson Examplesdata(educ.df) educ50.lm = lm(educ~urban + percap + under18, data=educ.df, subset=-50) funnel(educ50.lm) # funnel(educ~urban + percap + under18, data=educ.df, subset=-50) Results
R version 3.3.1 (2016-06-21) -- "Bug in Your Hair"
Copyright (C) 2016 The R Foundation for Statistical Computing
Platform: x86_64-pc-linux-gnu (64-bit)

R is free software and comes with ABSOLUTELY NO WARRANTY.
You are welcome to redistribute it under certain conditions.
Type 'license()' or 'licence()' for distribution details.

R is a collaborative project with many contributors.
Type 'contributors()' for more information and
'citation()' on how to cite R or R packages in publications.

Type 'demo()' for some demos, 'help()' for on-line help, or
'help.start()' for an HTML browser interface to help.
Type 'q()' to quit R.

> library(R330)
Loading required package: s20x
Loading required package: leaps
Loading required package: rgl
Loading required package: lattice
> png(filename="/home/ddbj/snapshot/RGM3/R_CC/result/R330/funnel.Rd_%03d_medium.png", width=480, height=480)
> ### Name: funnel
> ### Title: Plots for checking for unequal variances
> ### Aliases: funnel funnel.lm funnel.formula
> ### Keywords: aplot
>
> ### ** Examples
>
> data(educ.df)
> educ50.lm = lm(educ~urban + percap + under18, data=educ.df, subset=-50)
> funnel(educ50.lm)
Slope: 1.723989
> #
> funnel(educ~urban + percap + under18, data=educ.df, subset=-50)
Slope: 1.723989
>
>
>
>
>
> dev.off()
null device
          1
>
|