Supported by Dr. Osamu Ogasawara and  . . |
|
Last data update: 2014.03.03 |
Assign colours to helicesDescriptionFunctions to generate colours for helices by various rules, including integer counts, value ranges, percent identity covariation, conservation, percentage canonical basepair, basepair frequency, and non-pseudoknotted groups. Usage
    colourByCount(helix, cols, counts, get = FALSE)
    colourByValue(helix, cols, breaks, get = FALSE,
        log = FALSE, include.lowest = TRUE, ...)
    colourByBasepairFrequency(helix, cols, get = TRUE)
    colourByUnknottedGroups(helix, cols, get = TRUE)
    colourByCovariation(helix, msa, cols, get = FALSE)
    colourByConservation(helix, msa, cols, get = FALSE)
    colourByCanonical(helix, msa, cols, get = FALSE)
    defaultPalette()
Arguments
Details
ValueAll “colourBy” functions return a list of colours when
Author(s)Daniel Lai See Also
Examples
data(helix)
known$col <- colourByCount(known)
plotHelix(known)
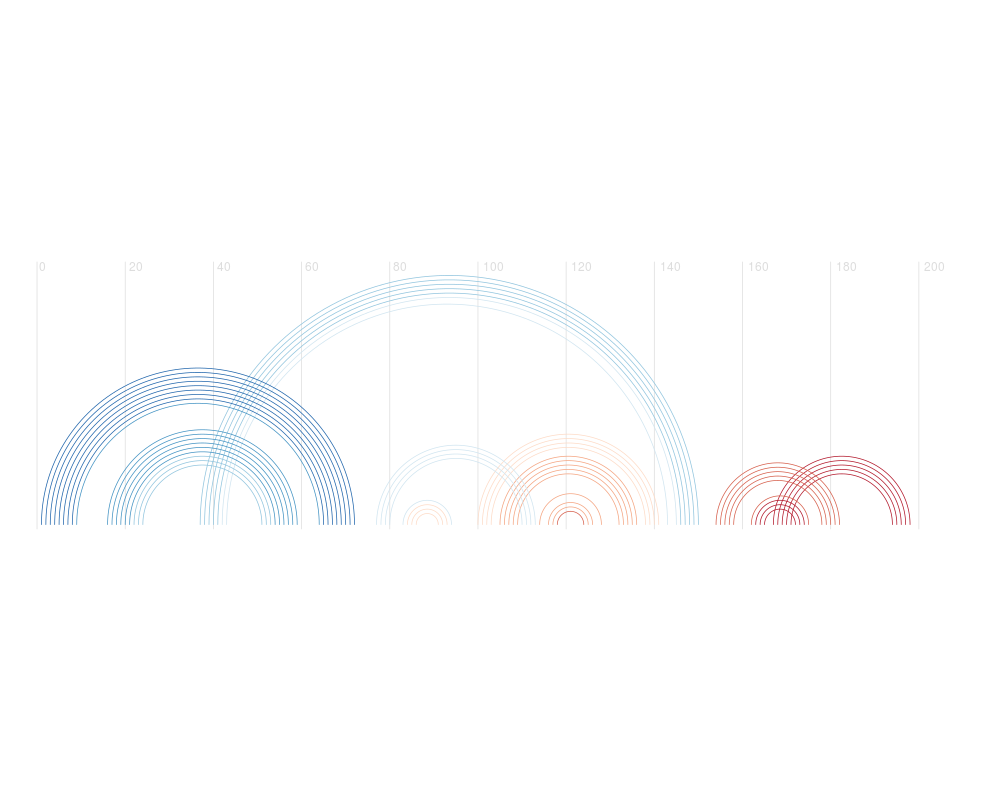
plotHelix(colourByValue(helix, log = TRUE, get = TRUE))
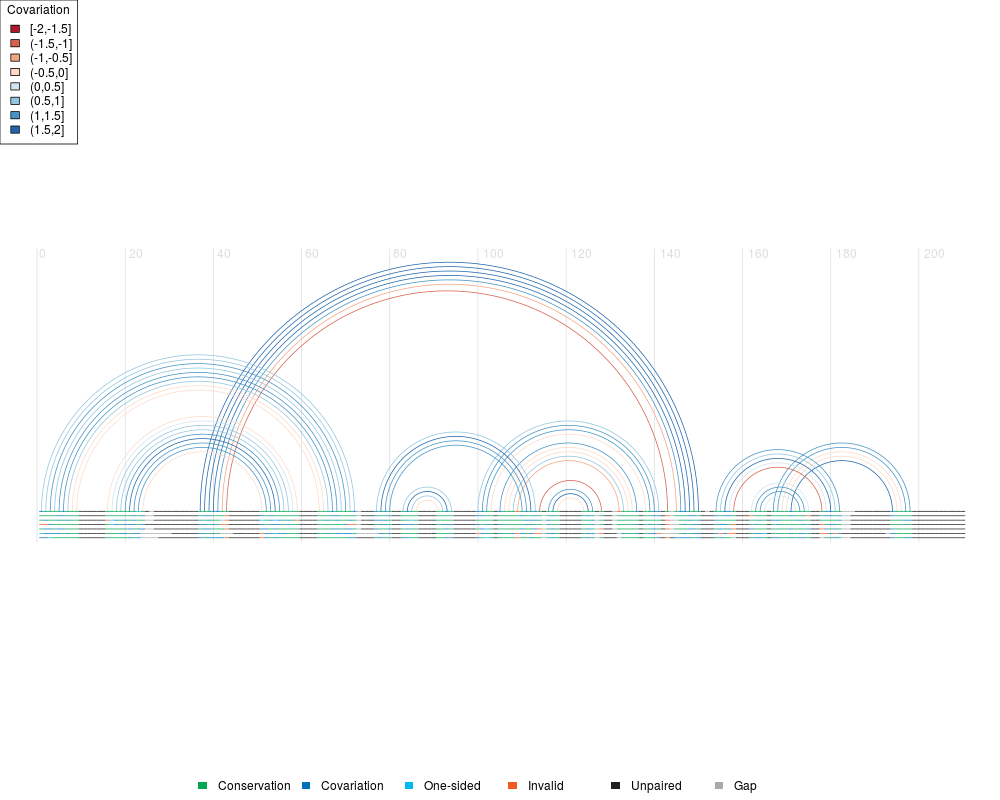
cov <- colourByCovariation(known, fasta, get = TRUE)
plotCovariance(fasta, cov)
legend("topleft", legend = attr(cov, "legend"),
fill = attr(cov, "fill"), title = "Covariation")
Results
R version 3.3.1 (2016-06-21) -- "Bug in Your Hair"
Copyright (C) 2016 The R Foundation for Statistical Computing
Platform: x86_64-pc-linux-gnu (64-bit)

R is free software and comes with ABSOLUTELY NO WARRANTY.
You are welcome to redistribute it under certain conditions.
Type 'license()' or 'licence()' for distribution details.

R is a collaborative project with many contributors.
Type 'contributors()' for more information and
'citation()' on how to cite R or R packages in publications.

Type 'demo()' for some demos, 'help()' for on-line help, or
'help.start()' for an HTML browser interface to help.
Type 'q()' to quit R.

> library(R4RNA)
Loading required package: Biostrings
Loading required package: BiocGenerics
Loading required package: parallel

Attaching package: 'BiocGenerics'

The following objects are masked from 'package:parallel':

    clusterApply, clusterApplyLB, clusterCall, clusterEvalQ,
    clusterExport, clusterMap, parApply, parCapply, parLapply,
    parLapplyLB, parRapply, parSapply, parSapplyLB

The following objects are masked from 'package:stats':

    IQR, mad, xtabs

The following objects are masked from 'package:base':

    Filter, Find, Map, Position, Reduce, anyDuplicated, append,
    as.data.frame, cbind, colnames, do.call, duplicated, eval, evalq,
    get, grep, grepl, intersect, is.unsorted, lapply, lengths, mapply,
    match, mget, order, paste, pmax, pmax.int, pmin, pmin.int, rank,
    rbind, rownames, sapply, setdiff, sort, table, tapply, union,
    unique, unsplit

Loading required package: S4Vectors
Loading required package: stats4

Attaching package: 'S4Vectors'

The following objects are masked from 'package:base':

    colMeans, colSums, expand.grid, rowMeans, rowSums

Loading required package: IRanges
Loading required package: XVector
> png(filename="/home/ddbj/snapshot/RGM3/R_BC/result/R4RNA/colourHelices.Rd_%03d_medium.png", width=480, height=480)
> ### Name: Colour Helices
> ### Title: Assign colours to helices
> ### Aliases: colourByCount colourByValue colourByConservation
> ###   colourByCovariation colourByCanonical colourByBasepairFrequency
> ###   colourByUnknottedGroups defaultPalette
> ### Keywords: color
>
> ### ** Examples
>
>     data(helix)
>
>     known$col <- colourByCount(known)
>     plotHelix(known)
>
>     plotHelix(colourByValue(helix, log = TRUE, get = TRUE))
>
>     cov <- colourByCovariation(known, fasta, get = TRUE)
>     plotCovariance(fasta, cov)
>     legend("topleft", legend = attr(cov, "legend"),
+         fill = attr(cov, "fill"), title = "Covariation")
>
>
>
>
>
>
> dev.off()
null device
          1
>
|