Supported by Dr. Osamu Ogasawara and  . . |
|
Last data update: 2014.03.03 |
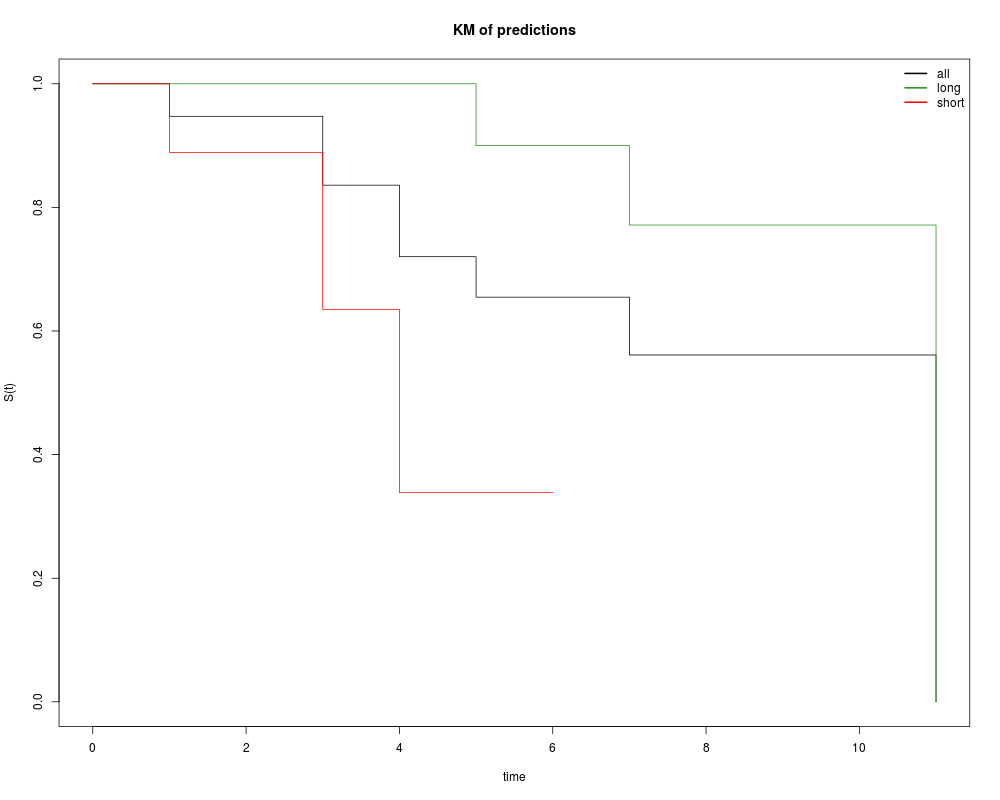
A function that plots the KM curves of $2-3$ patient sets in one graph.DescriptionThis function can plot the KM curves estimated for $2-3$ patients simultaneously for sake of easier comparison. Usagekmplt_svrl(all, long, short, title) Arguments
DetailsThis function essentially is the same as ValueA plot with all $2-3$ KM curves. Author(s)Douaa Mugahid Referenceshttp://www.bmj.com/statsbk/12.dtl See Also
Examplescensored <- c(1, 0, 1, 1, 1, 0, 1, 0, 0, 0) True_STs <- c(1, 4, 5, 4, 6, 3, 2, 1, 3, 4) dat1 <- as.data.frame(cbind(True_STs, censored)) censored <- c(1, 0, 1, 0, 1, 0, 1, 0, 1, 1) True_STs <- c(7, 7, 8, 5, 9, 11, 8, 11, 10, 6) dat2 <- as.data.frame(cbind(True_STs, censored)) censored <- c(1, 0, 1, 1, 1, 0, 1, 0, 0, 0, 1, 0, 1, 0, 1, 0, 1, 0, 1, 1) True_STs <- c(1, 4, 5, 4, 6, 3, 2, 1, 3, 4, 7, 7, 8, 5, 9, 11, 8, 11, 10, 6) dat3 <- as.data.frame(cbind(True_STs, censored)) kmplt_svrl(all=dat3, long=dat2, short=dat1, title="KM of predictions") Results
R version 3.3.1 (2016-06-21) -- "Bug in Your Hair"
Copyright (C) 2016 The R Foundation for Statistical Computing
Platform: x86_64-pc-linux-gnu (64-bit)

R is free software and comes with ABSOLUTELY NO WARRANTY.
You are welcome to redistribute it under certain conditions.
Type 'license()' or 'licence()' for distribution details.

R is a collaborative project with many contributors.
Type 'contributors()' for more information and
'citation()' on how to cite R or R packages in publications.

Type 'demo()' for some demos, 'help()' for on-line help, or
'help.start()' for an HTML browser interface to help.
Type 'q()' to quit R.

> library(RCASPAR)
> png(filename="/home/ddbj/snapshot/RGM3/R_BC/result/RCASPAR/kmplt_svrl.Rd_%03d_medium.png", width=480, height=480)
> ### Name: kmplt_svrl
> ### Title: A function that plots the KM curves of $2-3$ patient sets in one
> ###   graph.
> ### Aliases: kmplt_svrl
> ### Keywords: Kaplan-Meier estimator
>
> ### ** Examples
>
> censored <- c(1, 0, 1, 1, 1, 0, 1, 0, 0, 0)
> True_STs <- c(1, 4, 5, 4, 6, 3, 2, 1, 3, 4)
> dat1 <- as.data.frame(cbind(True_STs, censored))
> censored <- c(1, 0, 1, 0, 1, 0, 1, 0, 1, 1)
> True_STs <- c(7, 7, 8, 5, 9, 11, 8, 11, 10, 6)
> dat2 <- as.data.frame(cbind(True_STs, censored))
> censored <- c(1, 0, 1, 1, 1, 0, 1, 0, 0, 0, 1, 0, 1, 0, 1, 0, 1, 0, 1, 1)
> True_STs <- c(1, 4, 5, 4, 6, 3, 2, 1, 3, 4, 7, 7, 8, 5, 9, 11, 8, 11, 10, 6)
> dat3 <- as.data.frame(cbind(True_STs, censored))
> kmplt_svrl(all=dat3, long=dat2, short=dat1, title="KM of predictions")
>
>
>
>
>
> dev.off()
null device
          1
>
|