Supported by Dr. Osamu Ogasawara and  . . |
|
Last data update: 2014.03.03 |
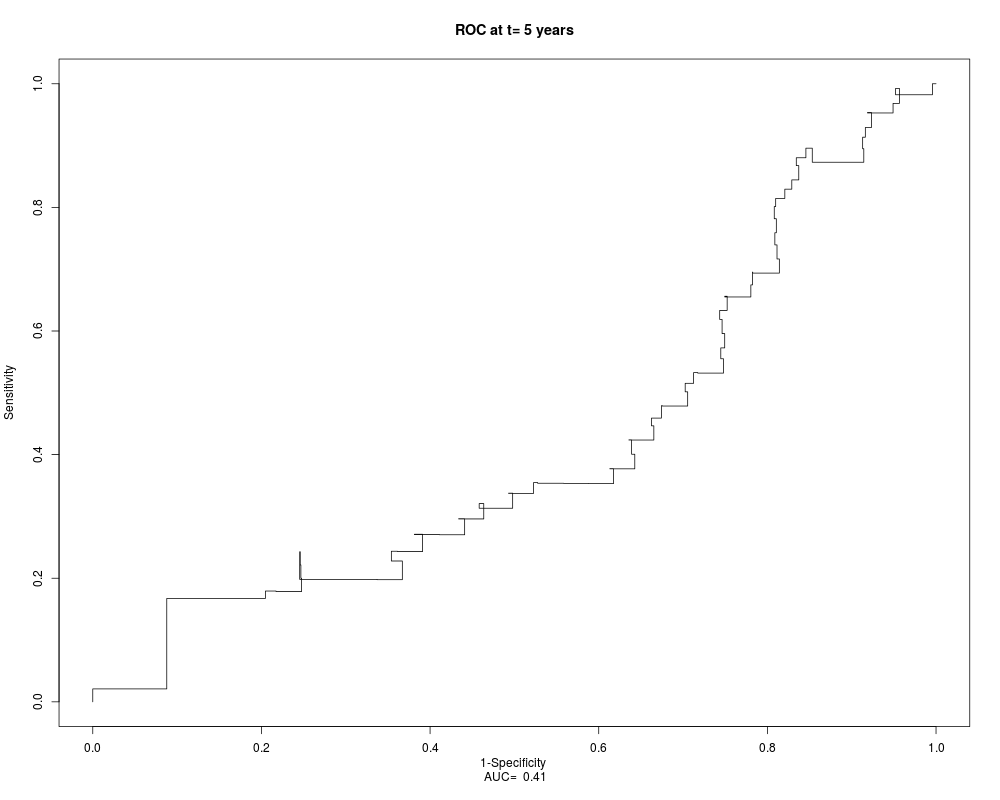
Generates the ROC curve at a given time point given the observed and predicted survival data in the presence of censored subjects.DescriptionThe function generates the Receiver-Operator Curve (ROC) at the specified time point using predicted and observed data in the presence of censored subjects. It so plots (1 - specificity) against the (specificity) at the designated cut off points. It is based on Patrick Heagerty's survivalROC function in the survivalROC package. UsagesurvivROC(Stime, status, marker, entry = NULL, predict.time, cut.values = NULL, plot = TRUE) Arguments
DetailsThis function is basically the survivROC function in Patrick Heagerty's survivROC package, with slight modifications to it to better suit our purpose. Unlike Heagerty's function it only performs the calculations using the KM estimator and does not provide any other methods as options. Value
NoteIt is important to note that using the Kaplan-Meier estimator as the method for estimating the survival function results in non-monotonous curves in some instances. Author(s)Douaa Mugahid ReferencesHeagerty,P., Lumely T. & Pepe M.(2000). Time-dependent ROC curves for censored survival data & a diagnostic marker. Biometrics, 56(2), 337-344. See Also
ExamplesTrue_STs <- c(1.416667,2.75,2.416667,2.583333,2.166667,2.5,2.5,1.833333,1.25,0.6666667,1,6.583333,6.5,6.666667,2.75,1.666667,1.166667,2.833333,3.583333,6.166667,6.166667, 3.416667,6.083333,1.833333,5.583333,0.75,5.75,5.5,0.5833333,7.666667,5,2.833333,1.333333,5.083333,0.8333333,1.5,4.75,3.416667,4.666667,1.916667,4.666667,7.416667,0.9166667, 1.083333,3.75,3.25,3,2.416667,2.75,2.5,2.666667,4.5,4.416667,1.5,0.8333333,3.166667,3.833333,3.833333,0.4166667,3.333333,2.75,3.083333,0.3333333,0.25,0.6666667,1.833333, 2.333333,3.416667,3.416667,3,0.6666667,0.75,2.166667,1,1.416667,1.333333,1.166667,1.166667,0.4166667,1.25,1.166667,1.083333) Predicted_STs <- c(6.030591,6.014457,3.545584,5.414229,6.41576,9.393992,5.542331,6.890859,8.090213,4.98545,2.77357,6.275699,9.163978,7.511511,9.531218,7.63715,10.08977, 11.12364,3.982502,5.441881,12.61404,12.21851,17.05850,12.78141,16.22795,21.48544,6.281354,13.83925,8.859929,6.104142,8.255909,2.335526,6.564962,2.335761,9.33772,12.62540, 10.97276,15.63089,8.01967,5.817267,5.59897,4.340784,32.40319,33.74123,27.45024,26.31024,26.88833,24.34707,32.06541,38.90473,17.37102,15.11059,8.772035,14.24816,7.852889, 7.79996,5.601459,2.802408,35.77047,24.34717,30.65796,25.93927,20.64544,22.04807,19.15037,23.83430,1.876557,3.937208,6.526354,5.886377,9.301074,12.4657,14.49783,15.41502, 2.860931,2.541947,4.543111,4.525553,4.148272,3.986912,6.246755,6.89523) censored <- c(0,1,1,1,1,0,1,1,0,1,0,1,1,1,1,0,0,0,0,1,1,1,1,0,1,0,1,1,0,1,1,0,0,1,0,0,1,0,1,0,1,1,0,0,1,1,1,0,1,1,1,1,1,0,1,1,1,1,0,1,1,1,1,0,0,0,1,1,1,1,0,0,1,0,1,1,1,1,1,1,1, 1) survivROC(Stime=True_STs,status=censored, marker=Predicted_STs,predict.time=5) Results
R version 3.3.1 (2016-06-21) -- "Bug in Your Hair"
Copyright (C) 2016 The R Foundation for Statistical Computing
Platform: x86_64-pc-linux-gnu (64-bit)

R is free software and comes with ABSOLUTELY NO WARRANTY.
You are welcome to redistribute it under certain conditions.
Type 'license()' or 'licence()' for distribution details.

R is a collaborative project with many contributors.
Type 'contributors()' for more information and
'citation()' on how to cite R or R packages in publications.

Type 'demo()' for some demos, 'help()' for on-line help, or
'help.start()' for an HTML browser interface to help.
Type 'q()' to quit R.

> library(RCASPAR)
> png(filename="/home/ddbj/snapshot/RGM3/R_BC/result/RCASPAR/survivROC.Rd_%03d_medium.png", width=480, height=480)
> ### Name: survivROC
> ### Title: Generates the ROC curve at a given time point given the observed
> ###   and predicted survival data in the presence of censored subjects.
> ### Aliases: survivROC
> ### Keywords: ROC curves survival analysis
>
> ### ** Examples
>
> True_STs <- c(1.416667,2.75,2.416667,2.583333,2.166667,2.5,2.5,1.833333,1.25,0.6666667,1,6.583333,6.5,6.666667,2.75,1.666667,1.166667,2.833333,3.583333,6.166667,6.166667,
+ 3.416667,6.083333,1.833333,5.583333,0.75,5.75,5.5,0.5833333,7.666667,5,2.833333,1.333333,5.083333,0.8333333,1.5,4.75,3.416667,4.666667,1.916667,4.666667,7.416667,0.9166667,
+ 1.083333,3.75,3.25,3,2.416667,2.75,2.5,2.666667,4.5,4.416667,1.5,0.8333333,3.166667,3.833333,3.833333,0.4166667,3.333333,2.75,3.083333,0.3333333,0.25,0.6666667,1.833333,
+ 2.333333,3.416667,3.416667,3,0.6666667,0.75,2.166667,1,1.416667,1.333333,1.166667,1.166667,0.4166667,1.25,1.166667,1.083333)
> Predicted_STs <- c(6.030591,6.014457,3.545584,5.414229,6.41576,9.393992,5.542331,6.890859,8.090213,4.98545,2.77357,6.275699,9.163978,7.511511,9.531218,7.63715,10.08977,
+ 11.12364,3.982502,5.441881,12.61404,12.21851,17.05850,12.78141,16.22795,21.48544,6.281354,13.83925,8.859929,6.104142,8.255909,2.335526,6.564962,2.335761,9.33772,12.62540,
+ 10.97276,15.63089,8.01967,5.817267,5.59897,4.340784,32.40319,33.74123,27.45024,26.31024,26.88833,24.34707,32.06541,38.90473,17.37102,15.11059,8.772035,14.24816,7.852889,
+ 7.79996,5.601459,2.802408,35.77047,24.34717,30.65796,25.93927,20.64544,22.04807,19.15037,23.83430,1.876557,3.937208,6.526354,5.886377,9.301074,12.4657,14.49783,15.41502,
+ 2.860931,2.541947,4.543111,4.525553,4.148272,3.986912,6.246755,6.89523)
> censored <- c(0,1,1,1,1,0,1,1,0,1,0,1,1,1,1,0,0,0,0,1,1,1,1,0,1,0,1,1,0,1,1,0,0,1,0,0,1,0,1,0,1,1,0,0,1,1,1,0,1,1,1,1,1,0,1,1,1,1,0,1,1,1,1,0,0,0,1,1,1,1,0,0,1,0,1,1,1,1,1,1,1,
+ 1)
> survivROC(Stime=True_STs,status=censored, marker=Predicted_STs,predict.time=5)
$cut.values
 [1]      -Inf  2.106041  2.335644  2.438854  2.657758  2.787989  2.831669
 [8]  3.203257  3.741396  3.959855  3.984707  4.067592  4.244528  4.433169
[15]  4.534332  4.764280  5.199839  5.428055  5.492106  5.570650  5.600214
[22]  5.709363  5.851822  5.950417  6.022524  6.067367  6.175448  6.261227
[29]  6.278526  6.348557  6.471057  6.545658  6.727911  6.893045  7.203371
[36]  7.574331  7.718555  7.826424  7.936279  8.054941  8.173061  8.513972
[43]  8.815982  9.011954  9.232526  9.319397  9.365856  9.462605  9.810494
[50] 10.531265 11.048200 11.671075 12.342105 12.539870 12.619720 12.703405
[57] 13.310330 14.043705 14.372995 14.804210 15.262805 15.522955 15.929420
[64] 16.643225 17.214760 18.260695 19.897905 21.065440 21.766755 22.941185
[71] 24.090685 24.347120 25.143220 26.124755 26.599285 27.169285 29.054100
[78] 31.361685 32.234300 33.072210 34.755850 37.337600 39.404730

$Comp.Specificity
 [1] 1.0000000 0.9821748 0.9924764 0.9682785 0.9527760 0.9535285 0.9292419
 [8] 0.9135443 0.8948918 0.8730116 0.8957963 0.8802806 0.8675175 0.8444934
[15] 0.8294908 0.8144851 0.8013226 0.7816220 0.7589534 0.7392861 0.7165404
[22] 0.6936453 0.6953055 0.6745942 0.6550623 0.6562666 0.6333187 0.6187269
[29] 0.5957905 0.5726522 0.5550577 0.5318487 0.5327762 0.5153474 0.5015889
[36] 0.4785633 0.4791497 0.4590372 0.4465276 0.4235972 0.4238493 0.4006179
[43] 0.3770068 0.3772680 0.3531610 0.3534337 0.3537224 0.3548333 0.3373101
[50] 0.3376398 0.3132349 0.3207219 0.2959151 0.2962930 0.2702836 0.2706840
[57] 0.2711178 0.2431833 0.2436438 0.2278717 0.1976449 0.1981402 0.2428441
[64] 0.2214508 0.1999978 0.1784730 0.1792697 0.1673184 0.1673184 0.1673184
[71] 0.1673184 0.1673184 0.1464036 0.1254888 0.1045740 0.0836592 0.0627444
[78] 0.0418296 0.0209148 0.0209148 0.0209148 0.0209148 0.0000000

$Sensitivity
 [1] 1.00000000 0.99567900 0.95202045 0.95661209 0.94904260 0.91873928
 [7] 0.92345506 0.91615838 0.91299434 0.91434460 0.85322748 0.84567650
[13] 0.83427573 0.83722579 0.82895716 0.82069276 0.80985066 0.80815245
[19] 0.81060533 0.80886050 0.81142122 0.81419075 0.78261800 0.78233331
[25] 0.78039929 0.74946407 0.75230752 0.74346439 0.74629171 0.74940137
[31] 0.74475780 0.74796636 0.71741829 0.71254277 0.70253417 0.70548638
[37] 0.67541528 0.67429323 0.66253784 0.66535687 0.63575331 0.63899328
[43] 0.64276434 0.61314802 0.61761264 0.58798032 0.55832556 0.52752102
[49] 0.52277761 0.49306555 0.49794680 0.45822476 0.46366802 0.43388855
[55] 0.44101378 0.41120284 0.38134524 0.39116284 0.36126778 0.35407535
[61] 0.36709897 0.33715527 0.24538266 0.24605180 0.24680458 0.24765774
[67] 0.21729250 0.20475640 0.17550548 0.14625457 0.11700365 0.08775274
[73] 0.08775274 0.08775274 0.08775274 0.08775274 0.08775274 0.08775274
[79] 0.08775274 0.05850183 0.02925091 0.00000000 0.00000000

$predict.time
[1] 5

$Survival
[1] 0.5830858

$AUC
[1] 0.4102913

>
>
>
>
>
> dev.off()
null device
          1
>
|