Supported by Dr. Osamu Ogasawara and  . . |
|
Last data update: 2014.03.03 |
IsomapDescriptionComputes the Isomap embedding as introduced in 2000 by Tenenbaum, de Silva and Langford. UsageIsomap(data, dims = 2, k, mod = FALSE, plotResiduals = FALSE, verbose = TRUE) Arguments
DetailsIsomap is a nonlinear dimension reduction technique, that preserves
global properties of the data. That means, that geodesic distances
between all samples are captured best in the low dimensional
embedding. ValueIt returns a N x dim matrix (N samples, dim features) with the reduced input data (list of several matrices if more than one dimension was specified) Author(s)Christoph Bartenhagen ReferencesTenenbaum, J. B. and de Silva, V. and Langford, J. C., "A global geometric framework for nonlinear dimensionality reduction.", 2000; Matlab code is available at http://waldron.stanford.edu/~isomap/ Examples## two dimensional Isomap embedding of a 1.000 dimensional dataset using k=5 neighbours d = generateData(samples=20, genes=1000, diffgenes=100, blocksize=10) d_low = Isomap(data=d[[1]], dims=2, k=5) ## Isomap residuals for target dimensions 1-10 d_low = Isomap(data=d[[1]], dims=1:10, k=5, plotResiduals=TRUE) ## three dimensional Isomap embedding of a 1.000 dimensional dataset using k=10 (nearest and farthest) neighbours d = generateData(samples=20, genes=1000, diffgenes=100, blocksize=10) d_low = Isomap(data=d[[1]], dims=3, mod=TRUE, k=10) Results
R version 3.3.1 (2016-06-21) -- "Bug in Your Hair"
Copyright (C) 2016 The R Foundation for Statistical Computing
Platform: x86_64-pc-linux-gnu (64-bit)
R is free software and comes with ABSOLUTELY NO WARRANTY.
You are welcome to redistribute it under certain conditions.
Type 'license()' or 'licence()' for distribution details.
R is a collaborative project with many contributors.
Type 'contributors()' for more information and
'citation()' on how to cite R or R packages in publications.
Type 'demo()' for some demos, 'help()' for on-line help, or
'help.start()' for an HTML browser interface to help.
Type 'q()' to quit R.
> library(RDRToolbox)
> png(filename="/home/ddbj/snapshot/RGM3/R_BC/result/RDRToolbox/Isomap.Rd_%03d_medium.png", width=480, height=480)
> ### Name: Isomap
> ### Title: Isomap
> ### Aliases: Isomap
>
> ### ** Examples
>
> ## two dimensional Isomap embedding of a 1.000 dimensional dataset using k=5 neighbours
> d = generateData(samples=20, genes=1000, diffgenes=100, blocksize=10)
> d_low = Isomap(data=d[[1]], dims=2, k=5)
Computing distance matrix ... done
Building graph with shortest paths (using 5 nearest neighbours) ... done
Computing low dimensional embedding ... done
number of samples: 20
reduction from 1000 to 2 dimensions
number of connected components in graph: 1
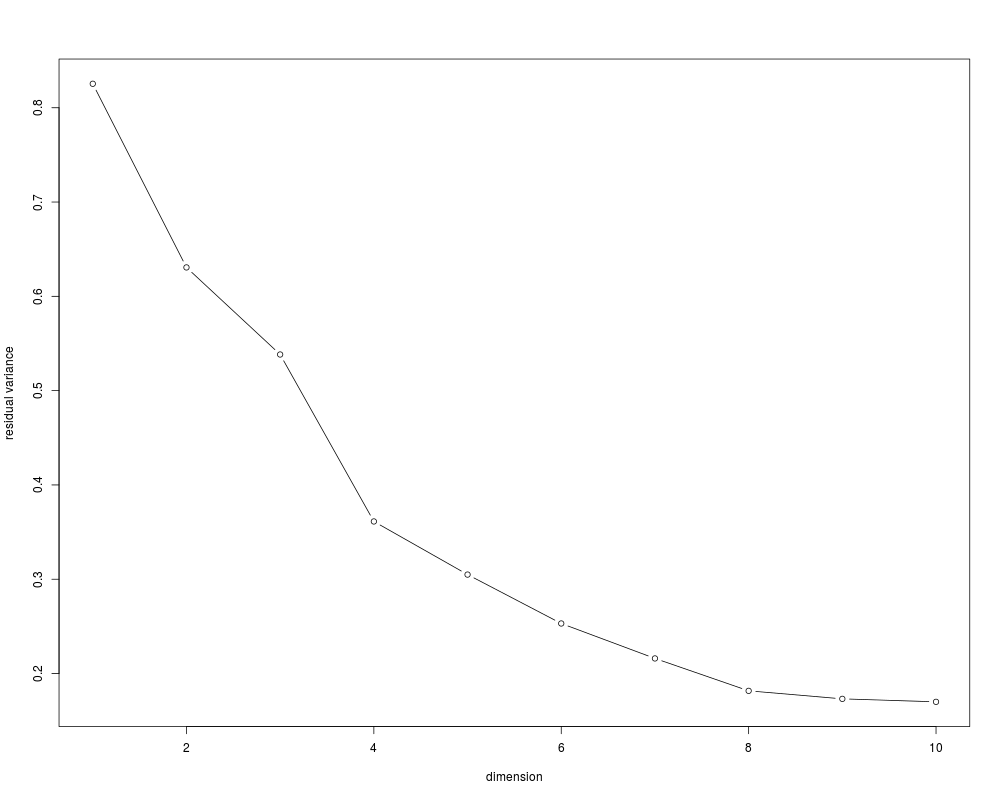
> ## Isomap residuals for target dimensions 1-10
> d_low = Isomap(data=d[[1]], dims=1:10, k=5, plotResiduals=TRUE)
Computing distance matrix ... done
Building graph with shortest paths (using 5 nearest neighbours) ... done
Computing low dimensional embedding ... done
number of samples: 20
reduction from 1000 to 12345678910 dimensions
number of connected components in graph: 1
>
> ## three dimensional Isomap embedding of a 1.000 dimensional dataset using k=10 (nearest and farthest) neighbours
> d = generateData(samples=20, genes=1000, diffgenes=100, blocksize=10)
> d_low = Isomap(data=d[[1]], dims=3, mod=TRUE, k=10)
Computing distance matrix ... done
Building graph with shortest paths (using 5 nearest and 5 farthest neighbours) ... done
Computing low dimensional embedding ... done
number of samples: 20
reduction from 1000 to 3 dimensions
number of connected components in graph: 1
>
>
>
>
>
> dev.off()
null device
1
>
|