matrix with values to be plotted (rows correspond to samples, columns to features)
labels
vector containing labels of the classes within the data (optional)
axesLabels
vector containing labels for the axes of the plot
legend
logical value whether to automatically insert a legend into the plot
text
vector with (short) labels for each point (optional)
col
character vector of colours for each class (optional); see colors() to display a list of available colours
pch
character or integer value specifying the symbol when plotting points (see ?par or ?points for more info)
...
other common R plot parameters like for example las, cex or font to further customize the plot (see ?par for
possible arguments); some parameters may only work with two dimensional plots
Details
It colours the data points according to given class labels (max. six classes when using default colours).
A legend will be printed in the R console by default (for three dimensional plots, a legend is not supported).
Author(s)
Christoph Bartenhagen
Examples
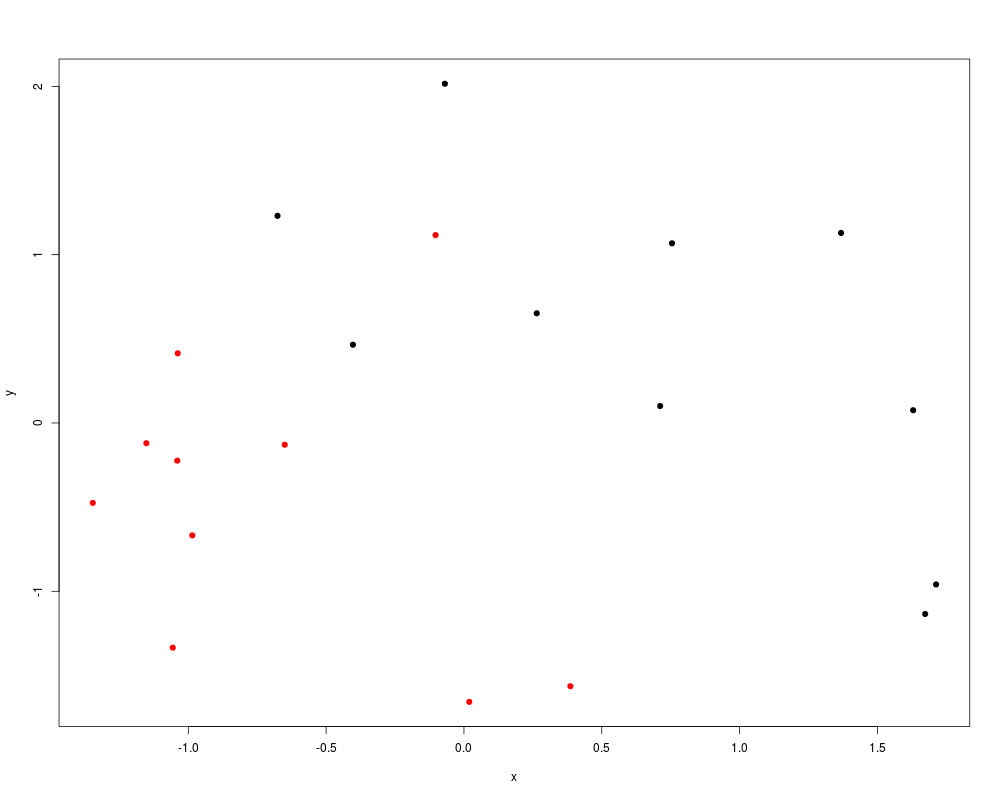
## plot a two dimensional LLE embedding of a 1.000 dimensional dataset
d = generateData(samples=20, genes=1000, diffgenes=100, blocksize=10)
d_low = LLE(data=d[[1]], dim=2, k=5)
plotDR(data=d_low, labels=d[[2]])
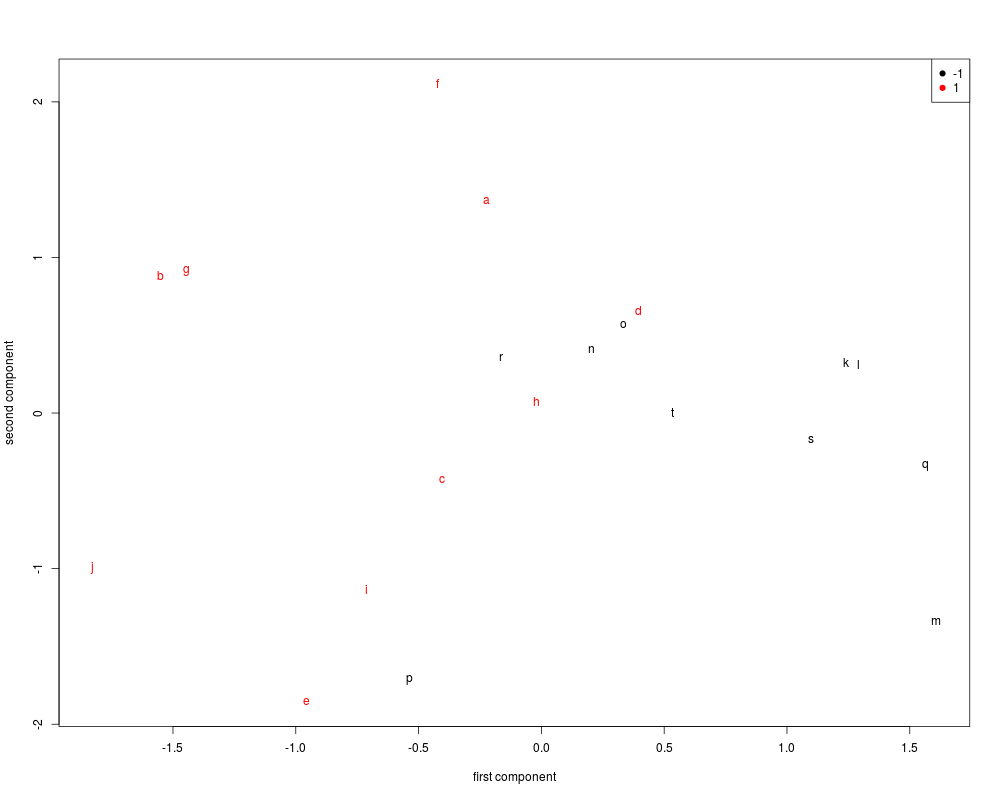
## plot a two dimensional LLE embedding of a 1.000 dimensional dataset
## add axis labels, a legend and plot a text for each sample
d = generateData(samples=20, genes=1000, diffgenes=100, blocksize=10)
d_low = LLE(data=d[[1]], dim=2, k=5)
text = letters[1:20]
plotDR(data=d_low, labels=d[[2]], axesLabels=c("first component", "second component"), text=text, legend=TRUE)
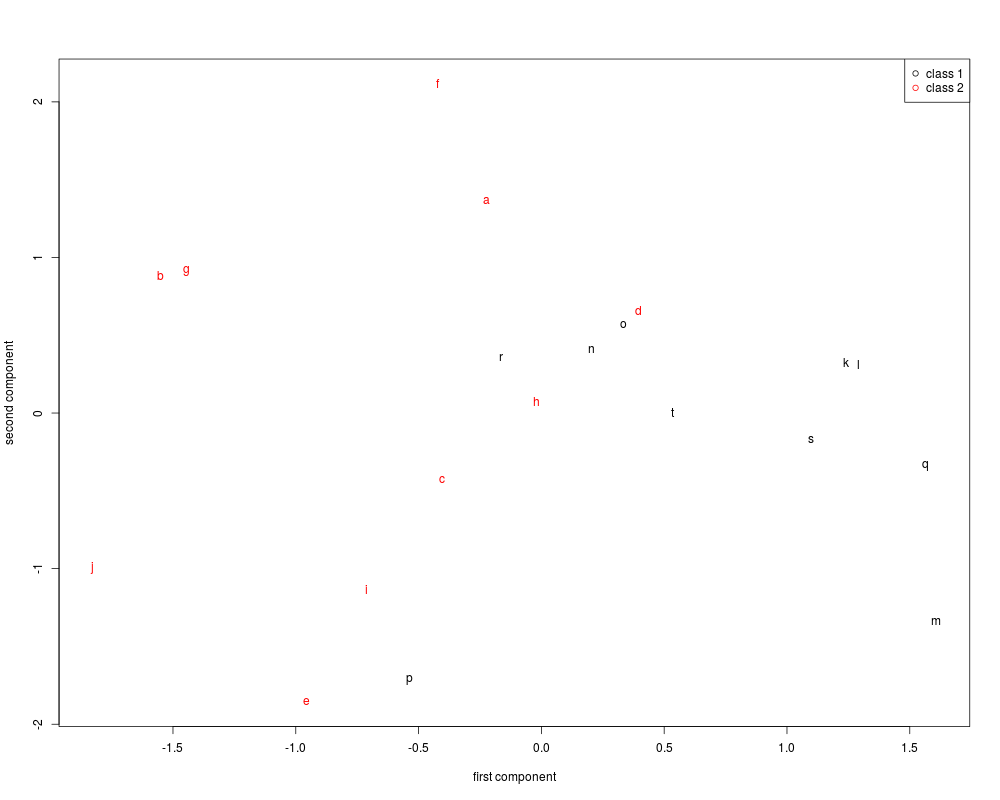
## manually add a legend to the plot
plotDR(data=d_low, labels=d[[2]], axesLabels=c("first component", "second component"), text=text)
legend("topright", legend=c("class 1","class 2"), col=c("black", "red"), pch=1)
Results
R version 3.3.1 (2016-06-21) -- "Bug in Your Hair"
Copyright (C) 2016 The R Foundation for Statistical Computing
Platform: x86_64-pc-linux-gnu (64-bit)

R is free software and comes with ABSOLUTELY NO WARRANTY.
You are welcome to redistribute it under certain conditions.
Type 'license()' or 'licence()' for distribution details.

R is a collaborative project with many contributors.
Type 'contributors()' for more information and
'citation()' on how to cite R or R packages in publications.

Type 'demo()' for some demos, 'help()' for on-line help, or
'help.start()' for an HTML browser interface to help.
Type 'q()' to quit R.

> library(RDRToolbox)
> png(filename="/home/ddbj/snapshot/RGM3/R_BC/result/RDRToolbox/plotDR.Rd_%03d_medium.png", width=480, height=480)
> ### Name: plotDR
> ### Title: Plotting tool for two and three dimensional data
> ### Aliases: plotDR
>
> ### ** Examples
>
> ## plot a two dimensional LLE embedding of a 1.000 dimensional dataset
> d = generateData(samples=20, genes=1000, diffgenes=100, blocksize=10)
> d_low = LLE(data=d[[1]], dim=2, k=5)
Computing distance matrix ... done
Computing low dimensional emmbedding (using 5 nearest neighbours)... done
> plotDR(data=d_low, labels=d[[2]])
legend:
  class colour
1    -1  black
2     1    red
>
> ## plot a two dimensional LLE embedding of a 1.000 dimensional dataset
> ## add axis labels, a legend and plot a text for each sample
> d = generateData(samples=20, genes=1000, diffgenes=100, blocksize=10)
> d_low = LLE(data=d[[1]], dim=2, k=5)
Computing distance matrix ... done
Computing low dimensional emmbedding (using 5 nearest neighbours)... done
> text = letters[1:20]
> plotDR(data=d_low, labels=d[[2]], axesLabels=c("first component", "second component"), text=text, legend=TRUE)
> ## manually add a legend to the plot
> plotDR(data=d_low, labels=d[[2]], axesLabels=c("first component", "second component"), text=text)
legend:
  class colour
1    -1  black
2     1    red
> legend("topright", legend=c("class 1","class 2"), col=c("black", "red"), pch=1)
>
>
>
>
>
>
> dev.off()
null device
          1
>
 .
.