Supported by Dr. Osamu Ogasawara and  . . |
|
Last data update: 2014.03.03 |
Function to Aggregate Directions From epplab ObjectsDescriptionFunction that automatically aggregates the projection directions from one or more UsageEPPlabAgg(x, method = "cumulative", percentage = 0.85) Arguments
DetailsDenote p_i, i=1,...,m, the projection vectors contained in the list of ValueA list with class 'epplabagg' containing the following components:
Author(s)Daniel Fischer, Klaus Nordhausen, Anne Ruiz-Gazen ReferencesLiski, E., Nordhausen, K., Oja, H. and Ruiz-Gazen, A. (201?), Combining Linear Dimension Reduction Estimates, to appear in the Proceedings of ICORS 2015, pp. ??-??. See Also
Examples
library(tourr)
data(olive)
# To keep the runtime short, maxiter and n.simu were chosen very
# small for demonstration purposes, real life applications would
# rather choose larger values, e.g. n.simu=100, maxiter=200
olivePP.kurt.max <-
EPPlab(olive[,3:10],PPalg="PSO",PPindex="KurtosisMax",n.simu=10, maxiter=20)
olivePP.fried <-
EPPlab(olive[,3:10],PPalg="PSO",PPindex="Friedman",n.simu=10, maxiter=20)
olivePPs <- list(olivePP.kurt.max, olivePP.fried)
EPPlabAgg(olivePP.kurt.max)$k
EPPlabAgg(olivePPs, "cum", 0.99)$k
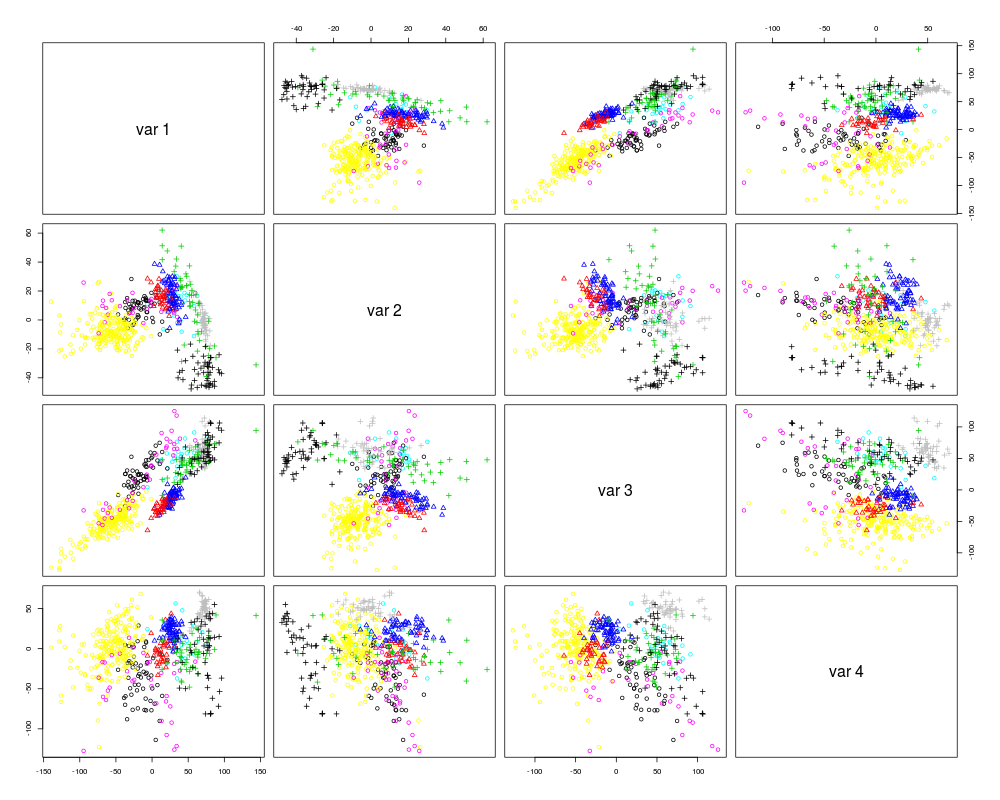
pairs(olivePP.kurt.max$x %*% EPPlabAgg(olivePPs, "cum", 0.99)$O,
col=olive[,2], pch=olive[,1])
olivAOP.sq <- EPPlabAgg(olivePPs, "inv")
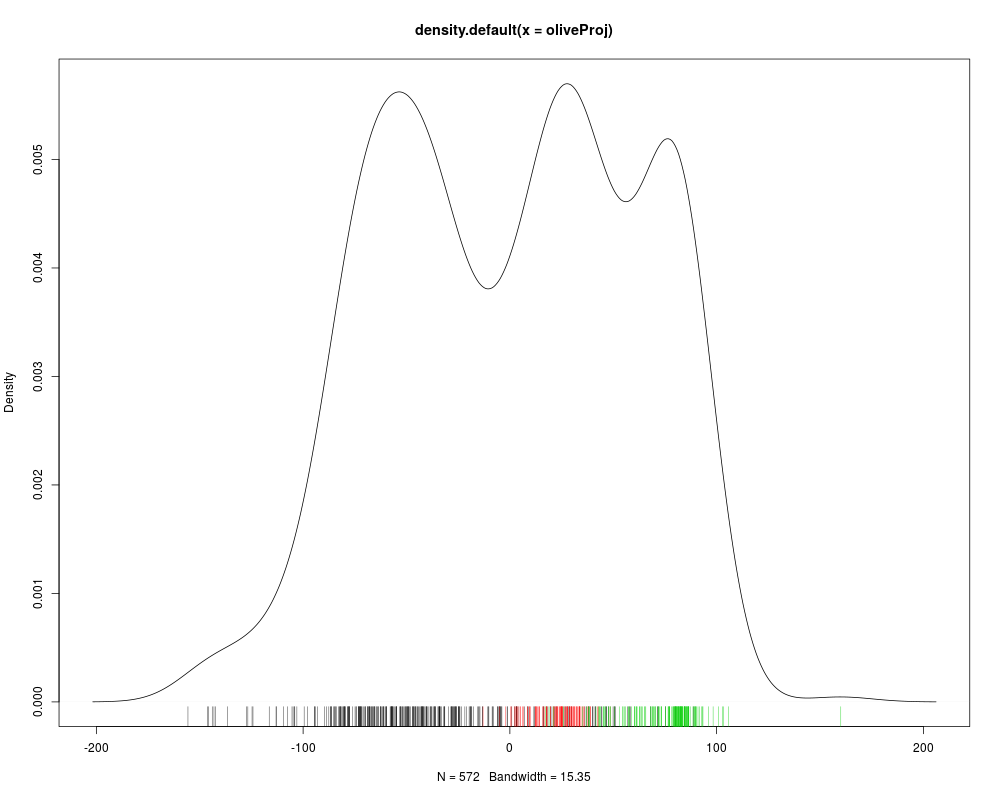
oliveProj <- olivePP.kurt.max$x %*% olivAOP.sq$O
plot(density(oliveProj))
rug(oliveProj[olive$region==1],col=1)
rug(oliveProj[olive$region==2],col=2)
rug(oliveProj[olive$region==3],col=3)
Results
R version 3.3.1 (2016-06-21) -- "Bug in Your Hair"
Copyright (C) 2016 The R Foundation for Statistical Computing
Platform: x86_64-pc-linux-gnu (64-bit)

R is free software and comes with ABSOLUTELY NO WARRANTY.
You are welcome to redistribute it under certain conditions.
Type 'license()' or 'licence()' for distribution details.

R is a collaborative project with many contributors.
Type 'contributors()' for more information and
'citation()' on how to cite R or R packages in publications.

Type 'demo()' for some demos, 'help()' for on-line help, or
'help.start()' for an HTML browser interface to help.
Type 'q()' to quit R.

> library(REPPlab)
Loading required package: rJava
Loading required package: lattice
Loading required package: LDRTools
> png(filename="/home/ddbj/snapshot/RGM3/R_CC/result/REPPlab/EPPlabAgg.Rd_%03d_medium.png", width=480, height=480)
> ### Name: EPPlabAgg
> ### Title: Function to Aggregate Directions From epplab Objects
> ### Aliases: EPPlabAgg
> ### Keywords: multivariate
>
> ### ** Examples
>
>
>  library(tourr)
>  data(olive)
>  # To keep the runtime short, maxiter and n.simu were chosen very
>  # small for demonstration purposes, real life applications would
>  # rather choose larger values, e.g. n.simu=100, maxiter=200
>  olivePP.kurt.max <-
+    EPPlab(olive[,3:10],PPalg="PSO",PPindex="KurtosisMax",n.simu=10, maxiter=20)

Simulation 0... finished (I 15803.749809761 in 0.610s)
Simulation 1... finished (I 16328.441668756 in 0.192s)
Simulation 2... finished (I 12773.246010155 in 0.046s)
Simulation 3... finished (I 14864.979690514 in 0.024s)
Simulation 4... finished (I 16355.465310614 in 0.465s)
Simulation 5... finished (I 13945.732375627 in 0.266s)
Simulation 6... finished (I 15344.965578953 in 0.023s)
Simulation 7... finished (I 13813.099231429 in 0.026s)
Simulation 8... finished (I 16404.088045583 in 0.056s)
Simulation 9... finished (I 14205.050358039 in 0.025s)
Warning message:
In EpplabOutputConv(jepplab, maxiter) :
  There were 10 non-converged simulation runs!
>
>  olivePP.fried <-
+    EPPlab(olive[,3:10],PPalg="PSO",PPindex="Friedman",n.simu=10, maxiter=20)
Simulation 0... finished (I 1.019258283 in 0.465s)
Simulation 1... finished (I 1.150387469 in 0.252s)
Simulation 2... finished (I 1.040278522 in 0.288s)
Simulation 3... finished (I 1.065690413 in 0.222s)
Simulation 4... finished (I 1.121890739 in 0.250s)
Simulation 5... finished (I 1.177554547 in 0.294s)
Simulation 6... finished (I 1.166704982 in 0.223s)
Simulation 7... finished (I 1.161123983 in 0.221s)
Simulation 8... finished (I 1.171488662 in 0.221s)
Simulation 9... finished (I 1.131404919 in 0.222s)
Warning message:
In EpplabOutputConv(jepplab, maxiter) :
  There were 10 non-converged simulation runs!
>
>  olivePPs <- list(olivePP.kurt.max, olivePP.fried)
>
>  EPPlabAgg(olivePP.kurt.max)$k
[1] 1
>  EPPlabAgg(olivePPs, "cum", 0.99)$k
[1] 4
>
>  pairs(olivePP.kurt.max$x %*% EPPlabAgg(olivePPs, "cum", 0.99)$O,
+        col=olive[,2], pch=olive[,1])
>
>
>  olivAOP.sq <- EPPlabAgg(olivePPs, "inv")
>  oliveProj <- olivePP.kurt.max$x %*% olivAOP.sq$O
>  plot(density(oliveProj))
>  rug(oliveProj[olive$region==1],col=1)
>  rug(oliveProj[olive$region==2],col=2)
>  rug(oliveProj[olive$region==3],col=3)
>
>
>
>
>
>
> dev.off()
null device
          1
>
|