Supported by Dr. Osamu Ogasawara and  . . |
|
Last data update: 2014.03.03 |
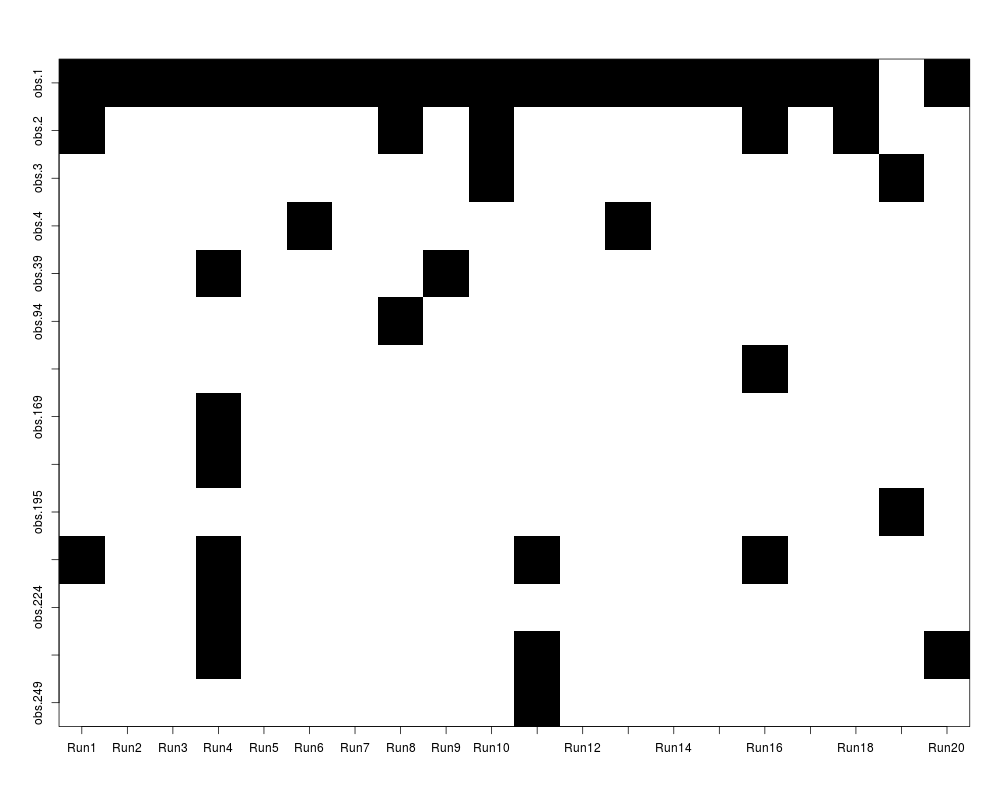
Plot for an epplabOutlier ObjectDescriptionVisualizes which observations are considered as outliers and how often for
an Usage
## S3 method for class 'epplabOutlier'
plot(x, col = c("white", "black"), outlier = TRUE,
  xlab = "", ylab = "", ...)
Arguments
Author(s)Daniel Fischer and Klaus Nordhausen See Also
Examples
# creating data with 3 outliers
n <-300
p <- 10
X <- matrix(rnorm(n*p),ncol=p)
X[1,1] <- 9
X[2,4] <- 7
X[3,6] <- 8
# giving the data rownames, obs.1, obs.2 and obs.3 are the outliers.
rownames(X) <- paste("obs",1:n,sep=".")

PP<-EPPlab(X,PPalg="PSO",PPindex="KurtosisMax",n.simu=20, maxiter=20)
OUT<-EPPlabOutlier(PP, k = 3, location = median, scale = mad)
plot(OUT)
Results
R version 3.3.1 (2016-06-21) -- "Bug in Your Hair"
Copyright (C) 2016 The R Foundation for Statistical Computing
Platform: x86_64-pc-linux-gnu (64-bit)

R is free software and comes with ABSOLUTELY NO WARRANTY.
You are welcome to redistribute it under certain conditions.
Type 'license()' or 'licence()' for distribution details.

R is a collaborative project with many contributors.
Type 'contributors()' for more information and
'citation()' on how to cite R or R packages in publications.

Type 'demo()' for some demos, 'help()' for on-line help, or
'help.start()' for an HTML browser interface to help.
Type 'q()' to quit R.

> library(REPPlab)
Loading required package: rJava
Loading required package: lattice
Loading required package: LDRTools
> png(filename="/home/ddbj/snapshot/RGM3/R_CC/result/REPPlab/plot.epplabOutlier.Rd_%03d_medium.png", width=480, height=480)
> ### Name: plot.epplabOutlier
> ### Title: Plot for an epplabOutlier Object
> ### Aliases: plot,epplabOutlier-method plot.epplabOutlier
> ### Keywords: hplot methods
>
> ### ** Examples
>
>
> # creating data with 3 outliers
> n <-300
> p <- 10
> X <- matrix(rnorm(n*p),ncol=p)
> X[1,1] <- 9
> X[2,4] <- 7
> X[3,6] <- 8
> # giving the data rownames, obs.1, obs.2 and obs.3 are the outliers.
> rownames(X) <- paste("obs",1:n,sep=".")
>
> PP<-EPPlab(X,PPalg="PSO",PPindex="KurtosisMax",n.simu=20, maxiter=20)

Simulation 0... finished (I 2976.540106651 in 0.385s)
Simulation 1... finished (I 2652.568573060 in 0.347s)
Simulation 2... finished (I 3933.379524120 in 0.018s)
Simulation 3... finished (I 3218.806509302 in 0.018s)
Simulation 4... finished (I 2355.420493685 in 0.057s)
Simulation 5... finished (I 2883.113850368 in 0.014s)
Simulation 6... finished (I 3081.815174335 in 0.251s)
Simulation 7... finished (I 3518.837050385 in 0.307s)
Simulation 8... finished (I 2507.981845376 in 0.152s)
Simulation 9... finished (I 3300.879185615 in 0.017s)
Simulation 10... finished (I 2753.740007368 in 0.017s)
Simulation 11... finished (I 2372.957562884 in 0.018s)
Simulation 12... finished (I 3409.064674831 in 0.042s)
Simulation 13... finished (I 3199.646248923 in 0.015s)
Simulation 14... finished (I 2777.705258517 in 0.014s)
Simulation 15... finished (I 3344.938023058 in 0.014s)
Simulation 16... finished (I 2302.609511212 in 0.037s)
Simulation 17... finished (I 2519.493342275 in 0.218s)
Simulation 18... finished (I 2684.579021459 in 0.015s)
Simulation 19... finished (I 2664.927489100 in 0.015s)
Warning message:
In EpplabOutputConv(jepplab, maxiter) :
  There were 20 non-converged simulation runs!
> OUT<-EPPlabOutlier(PP, k = 3, location = median, scale = mad)
> plot(OUT)
>
>
>
>
>
>
> dev.off()
null device
          1
>
|
Created & Maintained by Osamu Ogasawara (osamu.ogasawara@gmail.com) and 