Supported by Dr. Osamu Ogasawara and  . . |
|
Last data update: 2014.03.03 |
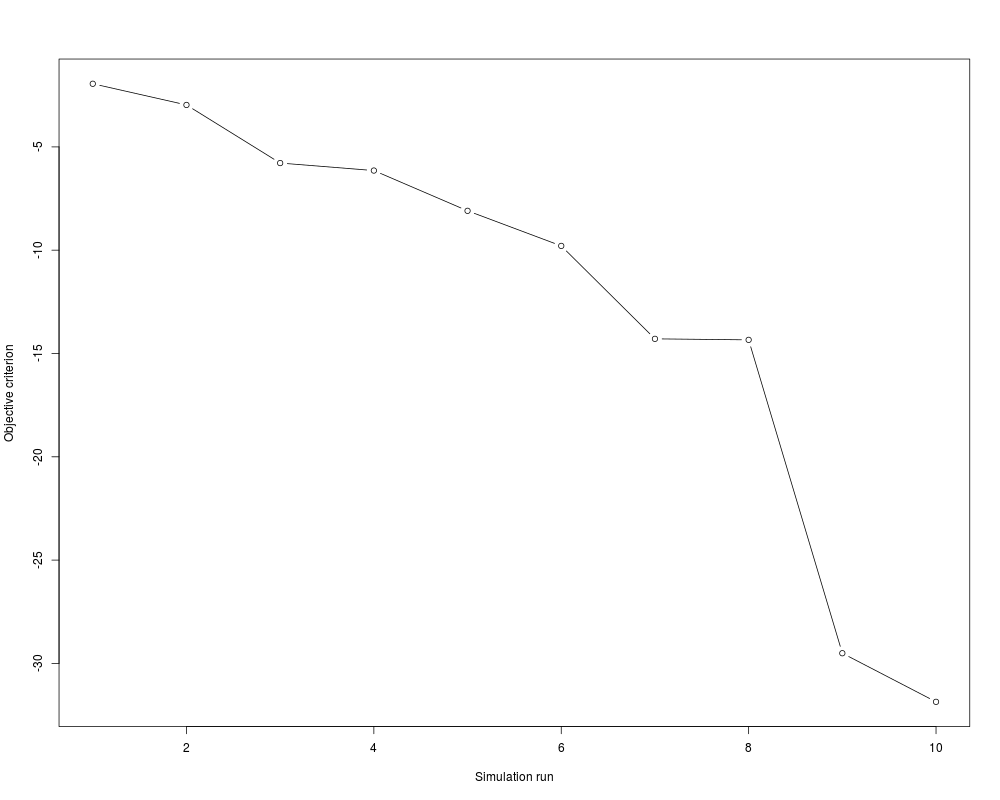
Creating a Screeplot for an epplab ObjectDescriptionPlots the objective criteria of an Usage## S3 method for class 'epplab' screeplot(x, type = "lines", which = 1:10, main = "", ylab = "Objective criterion", xlab = "Simulation run", ...) Arguments
DetailsThe option Author(s)Daniel Fischer Exampleslibrary(tourr) data(olive) res <- EPPlab(olive[,3:10],PPalg="PSO",PPindex="KurtosisMin",n.simu=10, maxiter=20) screeplot(res) # Pretty useless: screeplot(res,type="barplot") screeplot(res,which=1:5) Results
R version 3.3.1 (2016-06-21) -- "Bug in Your Hair"
Copyright (C) 2016 The R Foundation for Statistical Computing
Platform: x86_64-pc-linux-gnu (64-bit)
R is free software and comes with ABSOLUTELY NO WARRANTY.
You are welcome to redistribute it under certain conditions.
Type 'license()' or 'licence()' for distribution details.
R is a collaborative project with many contributors.
Type 'contributors()' for more information and
'citation()' on how to cite R or R packages in publications.
Type 'demo()' for some demos, 'help()' for on-line help, or
'help.start()' for an HTML browser interface to help.
Type 'q()' to quit R.
> library(REPPlab)
Loading required package: rJava
Loading required package: lattice
Loading required package: LDRTools
> png(filename="/home/ddbj/snapshot/RGM3/R_CC/result/REPPlab/screeplot.epplab.Rd_%03d_medium.png", width=480, height=480)
> ### Name: screeplot.epplab
> ### Title: Creating a Screeplot for an epplab Object
> ### Aliases: screeplot,epplab-method screeplot-method screeplot.epplab
> ### Keywords: hplot
>
> ### ** Examples
>
>
> library(tourr)
> data(olive)
> res <- EPPlab(olive[,3:10],PPalg="PSO",PPindex="KurtosisMin",n.simu=10, maxiter=20)
Simulation 0... finished (I -25.310923185 in 0.636s)
Simulation 1... finished (I -12.660380217 in 0.141s)
Simulation 2... finished (I -2.396567964 in 0.056s)
Simulation 3... finished (I -14.646794212 in 0.026s)
Simulation 4... finished (I -5.294570232 in 0.024s)
Simulation 5... finished (I -17.169626007 in 0.050s)
Simulation 6... finished (I -5.606818838 in 0.089s)
Simulation 7... finished (I -23.622736577 in 0.478s)
Simulation 8... finished (I -28.779739004 in 0.185s)
Simulation 9... finished (I -14.817990312 in 0.026s)
Warning message:
In EpplabOutputConv(jepplab, maxiter) :
There were 10 non-converged simulation runs!
> screeplot(res)
>
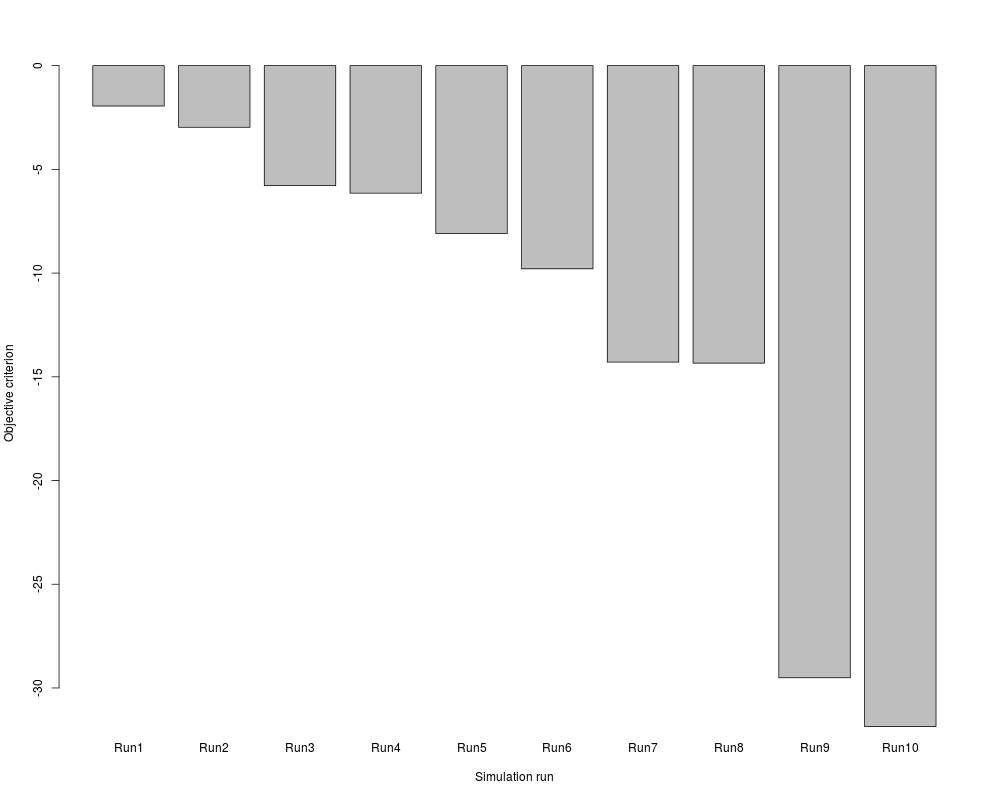
> # Pretty useless:
> screeplot(res,type="barplot")
>
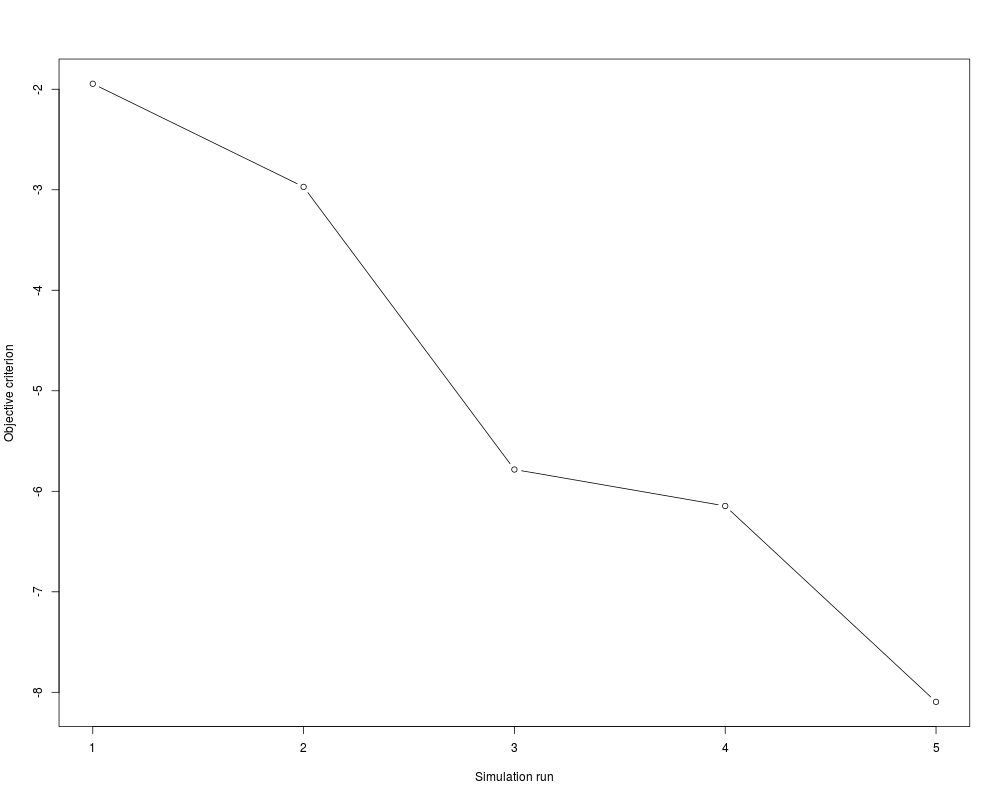
> screeplot(res,which=1:5)
>
>
>
>
>
>
> dev.off()
null device
1
>
|
Created & Maintained by Osamu Ogasawara (osamu.ogasawara@gmail.com) and 