Supported by Dr. Osamu Ogasawara and  . . |
|
Last data update: 2014.03.03 |
Grouped variable selection procedureDescriptionA grouped backward variable selection procedure. Usage
selectGroup(design, ydata, varNames, nvarGroup,
            typeRF = ifelse(is.factor(ydata), "classif", "reg"),
            verbose = TRUE, ntree = 500, ...)
Arguments
ValueAn object of class fRFE which is a list with the following components:
Author(s)Baptiste Gregorutti ReferencesGregorutti, B., Michel, B. and Saint Pierre, P. (2015). Grouped variable importance with random forests and application to multiple functional data analysis, Computational Statistics and Data Analysis 90, 15-35. See Also
Examples
  cat("\n\nClassification\n")
  data(toyClassif)
  attach(toyClassif)

  cat("Case 1\n")
  nvarGroup <- c(2,1,6); names(nvarGroup) <- paste("G", 1:length(nvarGroup), sep="")
  summary(varSel <- selectGroup(design=X, ydata=Y, nvarGroup=nvarGroup,
                                verbose=TRUE, ntree=500, normalize=FALSE))
  plot(varSel)

  cat("Case 2\n")
  nvarGroup <- rep(1,9); names(nvarGroup) <- paste("G", 1:length(nvarGroup), sep="")
  summary(varSel <- selectGroup(design=X, ydata=Y, nvarGroup=nvarGroup,
                                verbose=TRUE, ntree=500, normalize=FALSE))
  plot(varSel)

  detach(toyClassif)
Results
R version 3.3.1 (2016-06-21) -- "Bug in Your Hair"
Copyright (C) 2016 The R Foundation for Statistical Computing
Platform: x86_64-pc-linux-gnu (64-bit)
R is free software and comes with ABSOLUTELY NO WARRANTY.
You are welcome to redistribute it under certain conditions.
Type 'license()' or 'licence()' for distribution details.
R is a collaborative project with many contributors.
Type 'contributors()' for more information and
'citation()' on how to cite R or R packages in publications.
Type 'demo()' for some demos, 'help()' for on-line help, or
'help.start()' for an HTML browser interface to help.
Type 'q()' to quit R.
> library(RFgroove)
Loading required package: randomForest
randomForest 4.6-12
Type rfNews() to see new features/changes/bug fixes.
Loading required package: wmtsa
Loading required package: fda
Loading required package: splines
Loading required package: Matrix
Attaching package: 'fda'
The following object is masked from 'package:graphics':
matplot
> png(filename="/home/ddbj/snapshot/RGM3/R_CC/result/RFgroove/selectGroup.Rd_%03d_medium.png", width=480, height=480)
> ### Name: selectGroup
> ### Title: Grouped variable selection procedure
> ### Aliases: selectGroup
>
> ### ** Examples
>
> cat("\n\nClassification\n")
Classification
> data(toyClassif)
> attach(toyClassif)
>
> cat("Case 1\n")
Case 1
> nvarGroup <- c(2,1,6); names(nvarGroup) <- paste("G", 1:length(nvarGroup), sep="")
> summary(varSel <- selectGroup(design=X, ydata=Y, nvarGroup=nvarGroup,
+ verbose=TRUE, ntree=500, normalize=FALSE))
normalize = TRUE
G1 G2 G3
2 1 6
Classification backward selection.
Splitting data into a training and a testing set...
Survival indexes : 1 2 3 4 5 6 7 8 9
G1 G2 G3
0.167 0.106 0.001
G3 eliminated. 2 remaining groups of variables. Error = 0.12
Survival indexes : 1 2 3
G1 G2
0.188 0.131
G2 eliminated. 1 remaining groups of variables. Error = 0.13
Survival indexes : 1 2
G1 eliminated. No remaining groups of variables. Error = 0.37
Ending...
3 selected variables:
G1 G2 G3
--- ---
--- Summary functional RFE ---
--- ---
Number of selected variables using a validation set: 3
Selected variables:
G1 G2 G3
Validation error for the best model: 0.1226
> plot(varSel)
>
> cat("Case 2\n")
Case 2
> nvarGroup <- rep(1,9); names(nvarGroup) <- paste("G", 1:length(nvarGroup), sep="")
> summary(varSel <- selectGroup(design=X, ydata=Y, nvarGroup=nvarGroup,
+ verbose=TRUE, ntree=500, normalize=FALSE))
normalize = FALSE
G1 G2 G3 G4 G5 G6 G7 G8 G9
1 1 1 1 1 1 1 1 1
Classification backward selection.
Splitting data into a training and a testing set...
Survival indexes : 1 2 3 4 5 6 7 8 9
G3 G2 G1 G6 G7 G5 G9 G4 G8
0.110 0.096 0.055 0.002 0.000 -0.002 -0.002 -0.003 -0.004
G8 eliminated. 8 remaining groups of variables. Error = 0.14
Survival indexes : 1 2 3 4 5 6 7 9
G3 G2 G1 G7 G5 G6 G9 G4
0.099 0.086 0.061 0.001 0.000 0.000 -0.001 -0.004
G4 eliminated. 7 remaining groups of variables. Error = 0.12
Survival indexes : 1 2 3 5 6 7 9
G3 G2 G1 G7 G6 G9 G5
0.110 0.092 0.055 -0.001 -0.002 -0.003 -0.005
G5 eliminated. 6 remaining groups of variables. Error = 0.13
Survival indexes : 1 2 3 6 7 9
G3 G2 G1 G7 G6 G9
0.118 0.103 0.058 0.003 0.001 -0.003
G9 eliminated. 5 remaining groups of variables. Error = 0.14
Survival indexes : 1 2 3 6 7
G3 G2 G1 G7 G6
0.131 0.103 0.063 0.006 0.003
G6 eliminated. 4 remaining groups of variables. Error = 0.13
Survival indexes : 1 2 3 7
G3 G2 G1 G7
0.146 0.120 0.060 0.004
G7 eliminated. 3 remaining groups of variables. Error = 0.14
Survival indexes : 1 2 3
G3 G2 G1
0.134 0.106 0.071
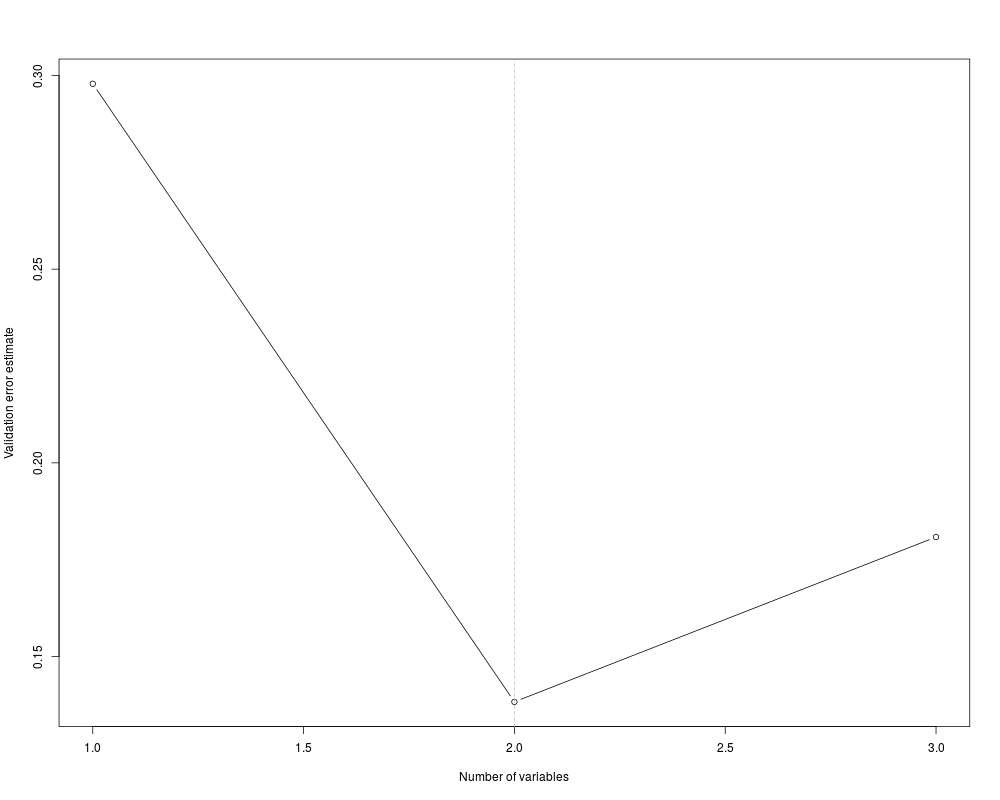
G1 eliminated. 2 remaining groups of variables. Error = 0.12
Survival indexes : 2 3
G2 G3
0.183 0.151
G3 eliminated. 1 remaining groups of variables. Error = 0.2
Survival indexes : 2
G2 eliminated. No remaining groups of variables. Error = 0.44
Ending...
3 selected variables:
G2 G3 G1
--- ---
--- Summary functional RFE ---
--- ---
Number of selected variables using a validation set: 3
Selected variables:
G2 G3 G1
Validation error for the best model: 0.12
> plot(varSel)
>
> detach(toyClassif)
>
>
>
>
>
>
> dev.off()
null device
1
>
|