Supported by Dr. Osamu Ogasawara and  . . |
|
Last data update: 2014.03.03 |
Plot read coverage for a GRanges objectDescriptionAn internal function used by UsageplotCoverage(x, plotLegend = FALSE, legend.cex = 1, ...) Arguments
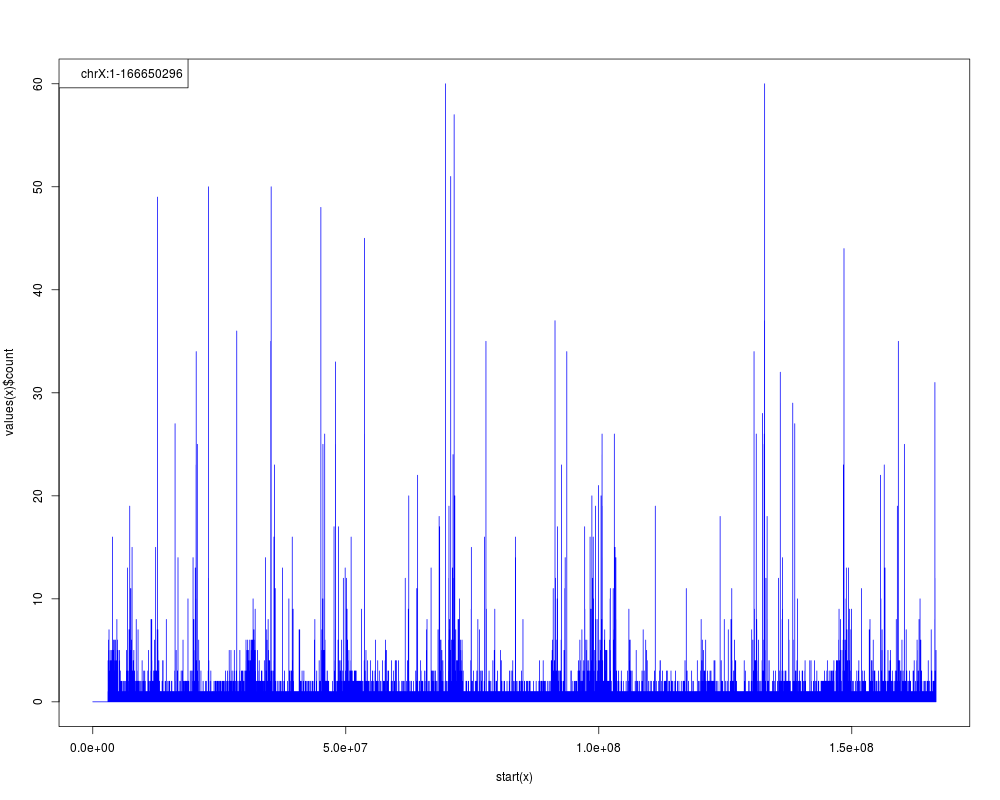
DetailsThe read counts is plotted in blue bars as positive integer across the x-axis as the sorted positions across the chromosome. The plot can be used to examine the overall alignment properties for each chromosome. NoteUsers are not recommanded run this function directly but rather via a much more user friendly function Author(s)Yue Li ReferencesP. Aboyoun, H. Pages and M. Lawrence (). GenomicRanges: Representation and manipulation of genomic intervals. R package version 1.8.9. See Also
Examples
# Retrieve system files
extdata.dir <- system.file("extdata", package="RIPSeeker")

bamFiles <- list.files(extdata.dir, ".bam$", recursive=TRUE, full.names=TRUE)

bamFiles <- grep("PRC2", bamFiles, value=TRUE)

alignGal <- getAlignGal(bamFiles[1], reverseComplement=TRUE, genomeBuild="mm9")

alignGR <- as(alignGal, "GRanges")

alignGRList <- GRangesList(as.list(split(alignGR, seqnames(alignGR))))

binSize <- 1000

binGR <- binCount(alignGRList$chrX, binSize)

plotCoverage(binGR, plotLegend=TRUE)
Results
R version 3.3.1 (2016-06-21) -- "Bug in Your Hair"
Copyright (C) 2016 The R Foundation for Statistical Computing
Platform: x86_64-pc-linux-gnu (64-bit)

R is free software and comes with ABSOLUTELY NO WARRANTY.
You are welcome to redistribute it under certain conditions.
Type 'license()' or 'licence()' for distribution details.

R is a collaborative project with many contributors.
Type 'contributors()' for more information and
'citation()' on how to cite R or R packages in publications.

Type 'demo()' for some demos, 'help()' for on-line help, or
'help.start()' for an HTML browser interface to help.
Type 'q()' to quit R.

> library(RIPSeeker)
Loading required package: S4Vectors
Loading required package: stats4
Loading required package: BiocGenerics
Loading required package: parallel

Attaching package: 'BiocGenerics'

The following objects are masked from 'package:parallel':

    clusterApply, clusterApplyLB, clusterCall, clusterEvalQ,
    clusterExport, clusterMap, parApply, parCapply, parLapply,
    parLapplyLB, parRapply, parSapply, parSapplyLB

The following objects are masked from 'package:stats':

    IQR, mad, xtabs

The following objects are masked from 'package:base':

    Filter, Find, Map, Position, Reduce, anyDuplicated, append,
    as.data.frame, cbind, colnames, do.call, duplicated, eval, evalq,
    get, grep, grepl, intersect, is.unsorted, lapply, lengths, mapply,
    match, mget, order, paste, pmax, pmax.int, pmin, pmin.int, rank,
    rbind, rownames, sapply, setdiff, sort, table, tapply, union,
    unique, unsplit


Attaching package: 'S4Vectors'

The following objects are masked from 'package:base':

    colMeans, colSums, expand.grid, rowMeans, rowSums

Loading required package: IRanges
Loading required package: GenomicRanges
Loading required package: GenomeInfoDb
Loading required package: SummarizedExperiment
Loading required package: Biobase
Welcome to Bioconductor

    Vignettes contain introductory material; view with
    'browseVignettes()'. To cite Bioconductor, see
    'citation("Biobase")', and for packages 'citation("pkgname")'.

Loading required package: Rsamtools
Loading required package: Biostrings
Loading required package: XVector
Loading required package: GenomicAlignments
Loading required package: rtracklayer
> png(filename="/home/ddbj/snapshot/RGM3/R_BC/result/RIPSeeker/plotCoverage.Rd_%03d_medium.png", width=480, height=480)
> ### Name: plotCoverage
> ### Title: Plot read coverage for a GRanges object
> ### Aliases: plotCoverage
>
> ### ** Examples
>
> # Retrieve system files
> extdata.dir <- system.file("extdata", package="RIPSeeker")
>
> bamFiles <- list.files(extdata.dir, ".bam$", recursive=TRUE, full.names=TRUE)
>
> bamFiles <- grep("PRC2", bamFiles, value=TRUE)
>
> alignGal <- getAlignGal(bamFiles[1], reverseComplement=TRUE, genomeBuild="mm9")
Processing /home/ddbj/local/lib64/R/library/RIPSeeker/extdata/PRC2/SRR039210_processed_tophat/accepted_hits_noDup_sel_chrX.bam ... All hits are returned with flags.
>
> alignGR <- as(alignGal, "GRanges")
>
> alignGRList <- GRangesList(as.list(split(alignGR, seqnames(alignGR))))
>
> binSize <- 1000
>
> binGR <- binCount(alignGRList$chrX, binSize)
>
> plotCoverage(binGR, plotLegend=TRUE)
>
>
>
>
>
>
>
> dev.off()
null device
          1
>
|