Supported by Dr. Osamu Ogasawara and  . . |
|
Last data update: 2014.03.03 |
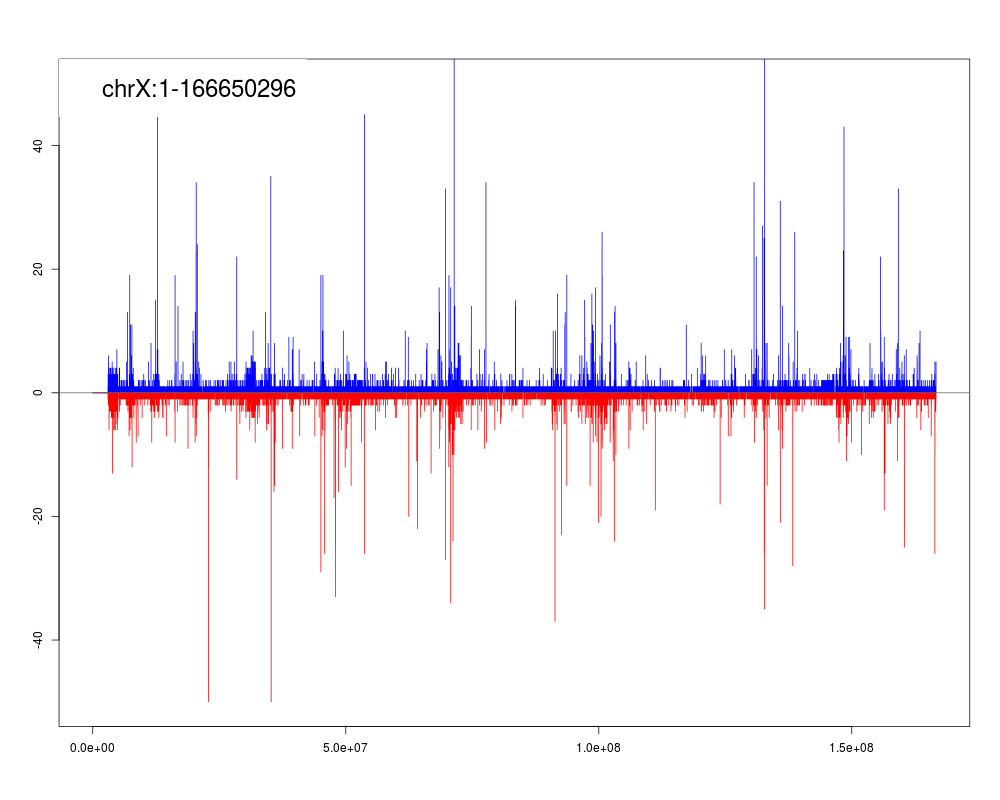
Plot strand-specific read coverage for a GRanges objectDescriptionPlot read counts within fixed bin across the entire chromosome. UsageplotStrandedCoverage(gr, binSize = 1000, plotLegend = FALSE, ylim, ...) Arguments
DetailsRead count on + and - strand are displayed as red and blue bars on the positive and negative y-axis, respectively. The x-axis indicates the positions across the chromosmoe. The plot can be used to examine for each chromosome the overall alignment properties such as strand specificity (expected in non-strand-specific sequencing) and aggregation of reads. Author(s)Yue Li ReferencesP. Aboyoun, H. Pages and M. Lawrence (). GenomicRanges: Representation and manipulation of genomic intervals. R package version 1.8.9. See Also
Examples
# Retrieve system files
extdata.dir <- system.file("extdata", package="RIPSeeker")

bamFiles <- list.files(extdata.dir, ".bam$", recursive=TRUE, full.names=TRUE)

bamFiles <- grep("PRC2", bamFiles, value=TRUE)

alignGal <- getAlignGal(bamFiles[1], reverseComplement=TRUE, genomeBuild="mm9")

alignGR <- as(alignGal, "GRanges")

alignGRList <- GRangesList(as.list(split(alignGR, seqnames(alignGR))))

binSize <- 1000

plotStrandedCoverage(gr=alignGRList$chrX, binSize=binSize,

		xlab="", ylab="", plotLegend=TRUE, box.lty=0, legend.cex=2 )
Results
R version 3.3.1 (2016-06-21) -- "Bug in Your Hair"
Copyright (C) 2016 The R Foundation for Statistical Computing
Platform: x86_64-pc-linux-gnu (64-bit)

R is free software and comes with ABSOLUTELY NO WARRANTY.
You are welcome to redistribute it under certain conditions.
Type 'license()' or 'licence()' for distribution details.

R is a collaborative project with many contributors.
Type 'contributors()' for more information and
'citation()' on how to cite R or R packages in publications.

Type 'demo()' for some demos, 'help()' for on-line help, or
'help.start()' for an HTML browser interface to help.
Type 'q()' to quit R.

> library(RIPSeeker)
Loading required package: S4Vectors
Loading required package: stats4
Loading required package: BiocGenerics
Loading required package: parallel

Attaching package: 'BiocGenerics'

The following objects are masked from 'package:parallel':

    clusterApply, clusterApplyLB, clusterCall, clusterEvalQ,
    clusterExport, clusterMap, parApply, parCapply, parLapply,
    parLapplyLB, parRapply, parSapply, parSapplyLB

The following objects are masked from 'package:stats':

    IQR, mad, xtabs

The following objects are masked from 'package:base':

    Filter, Find, Map, Position, Reduce, anyDuplicated, append,
    as.data.frame, cbind, colnames, do.call, duplicated, eval, evalq,
    get, grep, grepl, intersect, is.unsorted, lapply, lengths, mapply,
    match, mget, order, paste, pmax, pmax.int, pmin, pmin.int, rank,
    rbind, rownames, sapply, setdiff, sort, table, tapply, union,
    unique, unsplit


Attaching package: 'S4Vectors'

The following objects are masked from 'package:base':

    colMeans, colSums, expand.grid, rowMeans, rowSums

Loading required package: IRanges
Loading required package: GenomicRanges
Loading required package: GenomeInfoDb
Loading required package: SummarizedExperiment
Loading required package: Biobase
Welcome to Bioconductor

    Vignettes contain introductory material; view with
    'browseVignettes()'. To cite Bioconductor, see
    'citation("Biobase")', and for packages 'citation("pkgname")'.

Loading required package: Rsamtools
Loading required package: Biostrings
Loading required package: XVector
Loading required package: GenomicAlignments
Loading required package: rtracklayer
> png(filename="/home/ddbj/snapshot/RGM3/R_BC/result/RIPSeeker/plotStrandedCoverage.Rd_%03d_medium.png", width=480, height=480)
> ### Name: plotStrandedCoverage
> ### Title: Plot strand-specific read coverage for a GRanges object
> ### Aliases: plotStrandedCoverage
>
> ### ** Examples
>
> # Retrieve system files
> extdata.dir <- system.file("extdata", package="RIPSeeker")
>
> bamFiles <- list.files(extdata.dir, ".bam$", recursive=TRUE, full.names=TRUE)
>
> bamFiles <- grep("PRC2", bamFiles, value=TRUE)
>
> alignGal <- getAlignGal(bamFiles[1], reverseComplement=TRUE, genomeBuild="mm9")
Processing /home/ddbj/local/lib64/R/library/RIPSeeker/extdata/PRC2/SRR039210_processed_tophat/accepted_hits_noDup_sel_chrX.bam ... All hits are returned with flags.
>
> alignGR <- as(alignGal, "GRanges")
>
> alignGRList <- GRangesList(as.list(split(alignGR, seqnames(alignGR))))
>
> binSize <- 1000
>
> plotStrandedCoverage(gr=alignGRList$chrX, binSize=binSize,
+
+ 		xlab="", ylab="", plotLegend=TRUE, box.lty=0, legend.cex=2 )
Warning messages:
1: In plot.window(...) : "box.lty" is not a graphical parameter
2: In plot.xy(xy, type, ...) : "box.lty" is not a graphical parameter
3: In axis(side = side, at = at, labels = labels, ...) :
  "box.lty" is not a graphical parameter
4: In axis(side = side, at = at, labels = labels, ...) :
  "box.lty" is not a graphical parameter
5: In box(...) : "box.lty" is not a graphical parameter
6: In title(...) : "box.lty" is not a graphical parameter
>
>
>
>
>
>
> dev.off()
null device
          1
>
|