Supported by Dr. Osamu Ogasawara and  . . |
|
Last data update: 2014.03.03 |
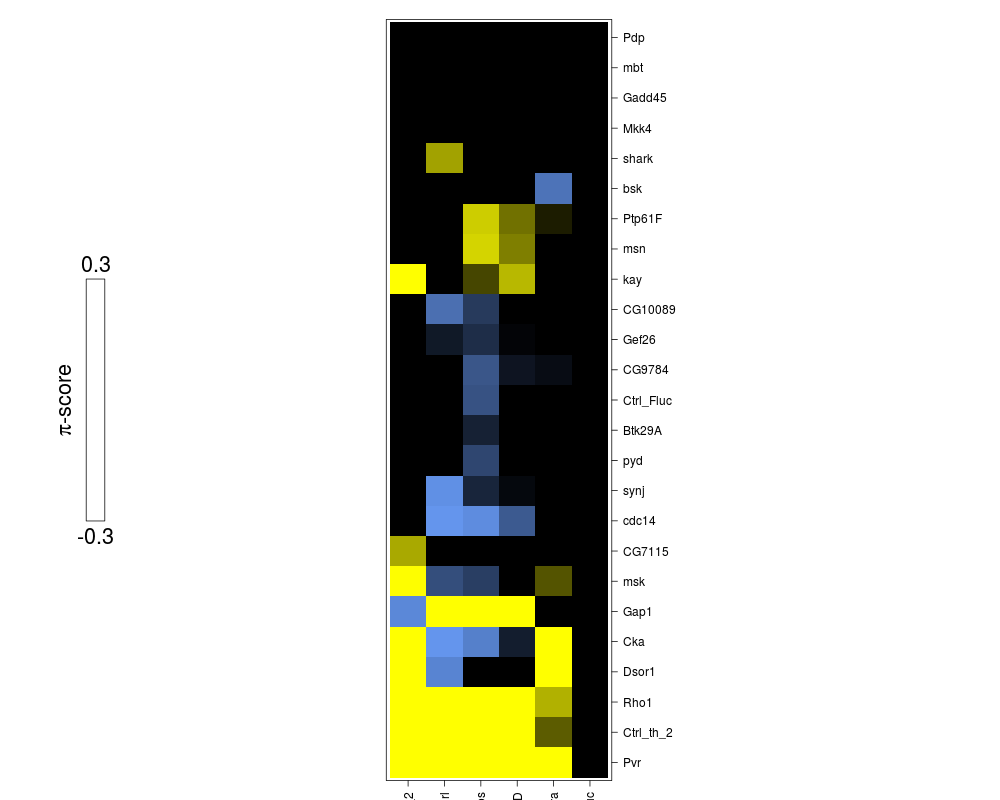
A heatmap grobDescriptionA grob is created and printed for a matrix PI which is intended to represent pairwise interaction scores. Usagegrid.sgiHeatmap(PI, pi.max = NULL, main = expression(paste(pi, "-score")), hc.row = NULL, hc.col = NULL) Arguments
DetailsA heatmap is plotted with positive interaction represented in yellow and negative interactions represented in blue. A colorbar is plotted on the left and dendrograms are added. This function can be used to integrate the plot in other grid objects. It is recommended to use the function ValueA grob is returned. Author(s)Bernd Fischer See Also
Examples
data("sgi")
PI = getData(sgi, type="pi", format="targetMatrix", screen="1", channel="nrCells")
grid.sgiHeatmap(PI)
Results
R version 3.3.1 (2016-06-21) -- "Bug in Your Hair"
Copyright (C) 2016 The R Foundation for Statistical Computing
Platform: x86_64-pc-linux-gnu (64-bit)

R is free software and comes with ABSOLUTELY NO WARRANTY.
You are welcome to redistribute it under certain conditions.
Type 'license()' or 'licence()' for distribution details.

R is a collaborative project with many contributors.
Type 'contributors()' for more information and
'citation()' on how to cite R or R packages in publications.

Type 'demo()' for some demos, 'help()' for on-line help, or
'help.start()' for an HTML browser interface to help.
Type 'q()' to quit R.

> library(RNAinteract)
Loading required package: abind
Loading required package: locfit
locfit 1.5-9.1 	 2013-03-22
Loading required package: Biobase
Loading required package: BiocGenerics
Loading required package: parallel

Attaching package: 'BiocGenerics'

The following objects are masked from 'package:parallel':

    clusterApply, clusterApplyLB, clusterCall, clusterEvalQ,
    clusterExport, clusterMap, parApply, parCapply, parLapply,
    parLapplyLB, parRapply, parSapply, parSapplyLB

The following objects are masked from 'package:stats':

    IQR, mad, xtabs

The following objects are masked from 'package:base':

    Filter, Find, Map, Position, Reduce, anyDuplicated, append,
    as.data.frame, cbind, colnames, do.call, duplicated, eval, evalq,
    get, grep, grepl, intersect, is.unsorted, lapply, lengths, mapply,
    match, mget, order, paste, pmax, pmax.int, pmin, pmin.int, rank,
    rbind, rownames, sapply, setdiff, sort, table, tapply, union,
    unique, unsplit

Welcome to Bioconductor

    Vignettes contain introductory material; view with
    'browseVignettes()'. To cite Bioconductor, see
    'citation("Biobase")', and for packages 'citation("pkgname")'.

> png(filename="/home/ddbj/snapshot/RGM3/R_BC/result/RNAinteract/grid.sgiHeatmap.Rd_%03d_medium.png", width=480, height=480)
> ### Name: grid.sgiHeatmap
> ### Title: A heatmap grob
> ### Aliases: grid.sgiHeatmap
> ### Keywords: hplot
>
> ### ** Examples
>
> data("sgi")
> PI = getData(sgi, type="pi", format="targetMatrix", screen="1", channel="nrCells")
> grid.sgiHeatmap(PI)
>
>
>
>
>
> dev.off()
null device
          1
>
|