Supported by Dr. Osamu Ogasawara and  . . |
|
Last data update: 2014.03.03 |
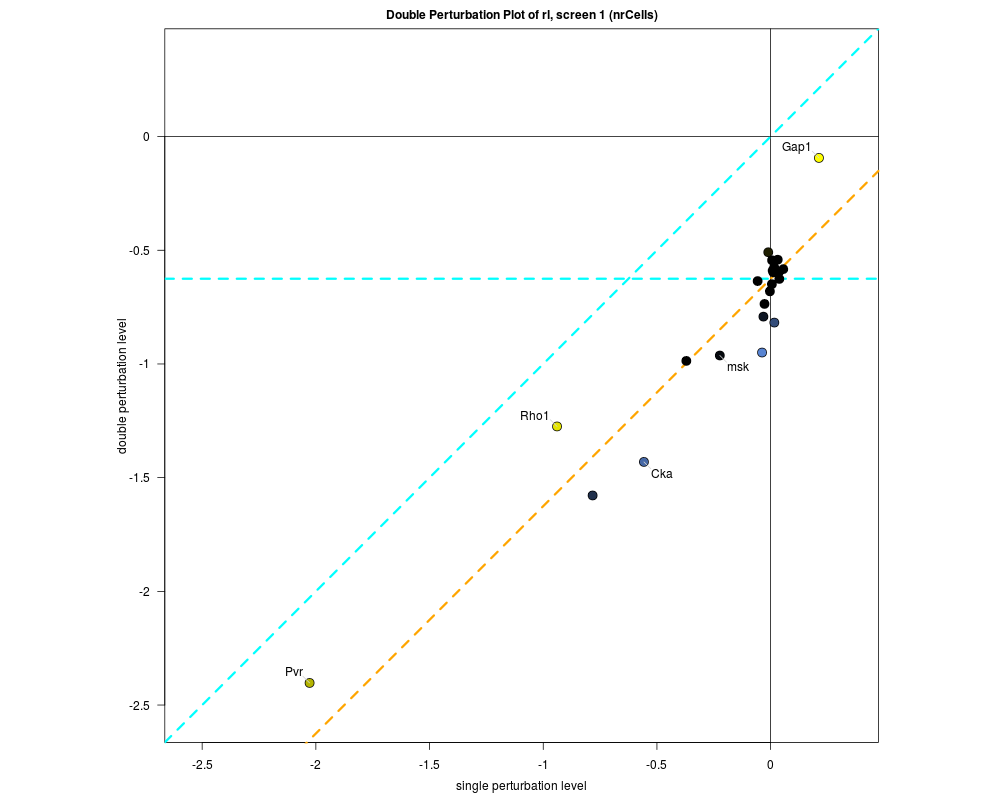
Double Perturbation PlotDescriptionThese function draws a double perturbation plot for interaction screens. All interactions of one gene are displayed in one panel. The double perturbation readout level is plotted against the single perturbation level. Usage
plotDoublePerturbation( sgi, screen, channel, target,
                       withoutgroups = c("neg", "pos"), design,
                       main, xlab, ylab, range,
                       show.labels = "none", label.par, label,
		       avoid.overlap, col, fill,
                       D , MT, MQ, PV, QV, PI, ...)
Arguments
DetailsPlots a double perturbation plot. It shows the interaction profile for one (query) gene. ValueA grob is returned. Author(s)Bernd Fischer See Also
Examples
data("sgi")
plotDoublePerturbation( sgi, screen="1", channel="nrCells", target="rl", show.labels="p.value")
Results
R version 3.3.1 (2016-06-21) -- "Bug in Your Hair"
Copyright (C) 2016 The R Foundation for Statistical Computing
Platform: x86_64-pc-linux-gnu (64-bit)

R is free software and comes with ABSOLUTELY NO WARRANTY.
You are welcome to redistribute it under certain conditions.
Type 'license()' or 'licence()' for distribution details.

R is a collaborative project with many contributors.
Type 'contributors()' for more information and
'citation()' on how to cite R or R packages in publications.

Type 'demo()' for some demos, 'help()' for on-line help, or
'help.start()' for an HTML browser interface to help.
Type 'q()' to quit R.

> library(RNAinteract)
Loading required package: abind
Loading required package: locfit
locfit 1.5-9.1 	 2013-03-22
Loading required package: Biobase
Loading required package: BiocGenerics
Loading required package: parallel

Attaching package: 'BiocGenerics'

The following objects are masked from 'package:parallel':

    clusterApply, clusterApplyLB, clusterCall, clusterEvalQ,
    clusterExport, clusterMap, parApply, parCapply, parLapply,
    parLapplyLB, parRapply, parSapply, parSapplyLB

The following objects are masked from 'package:stats':

    IQR, mad, xtabs

The following objects are masked from 'package:base':

    Filter, Find, Map, Position, Reduce, anyDuplicated, append,
    as.data.frame, cbind, colnames, do.call, duplicated, eval, evalq,
    get, grep, grepl, intersect, is.unsorted, lapply, lengths, mapply,
    match, mget, order, paste, pmax, pmax.int, pmin, pmin.int, rank,
    rbind, rownames, sapply, setdiff, sort, table, tapply, union,
    unique, unsplit

Welcome to Bioconductor

    Vignettes contain introductory material; view with
    'browseVignettes()'. To cite Bioconductor, see
    'citation("Biobase")', and for packages 'citation("pkgname")'.

> png(filename="/home/ddbj/snapshot/RGM3/R_BC/result/RNAinteract/plotDoublePerturbation.Rd_%03d_medium.png", width=480, height=480)
> ### Name: plotDoublePerturbation
> ### Title: Double Perturbation Plot
> ### Aliases: plotDoublePerturbation
> ### Keywords: hplot
>
> ### ** Examples
>
> data("sgi")
> plotDoublePerturbation( sgi, screen="1", channel="nrCells", target="rl", show.labels="p.value")
doublePerturbation[GRID.doublePerturbation.11]
>
>
>
>
>
> dev.off()
null device
          1
>
|