R version 3.3.1 (2016-06-21) -- "Bug in Your Hair"
Copyright (C) 2016 The R Foundation for Statistical Computing
Platform: x86_64-pc-linux-gnu (64-bit)
R is free software and comes with ABSOLUTELY NO WARRANTY.
You are welcome to redistribute it under certain conditions.
Type 'license()' or 'licence()' for distribution details.
R is a collaborative project with many contributors.
Type 'contributors()' for more information and
'citation()' on how to cite R or R packages in publications.
Type 'demo()' for some demos, 'help()' for on-line help, or
'help.start()' for an HTML browser interface to help.
Type 'q()' to quit R.
> library(ROC)
> png(filename="/home/ddbj/snapshot/RGM3/R_BC/result/ROC/plot-methods.Rd_%03d_medium.png", width=480, height=480)
> ### Name: plot-methods
> ### Title: plot method for ROC curves
> ### Aliases: plot,rocc-method lines,rocc-method points,rocc-method
> ### Keywords: methods
>
> ### ** Examples
>
> set.seed(123)
> R1 <- rocdemo.sca( rbinom(40,1,.3), rnorm(40), dxrule.sca,
+ caseLabel="new case", markerLabel="demo Marker" )
NA in cutpts forces recomputation using smallest gap
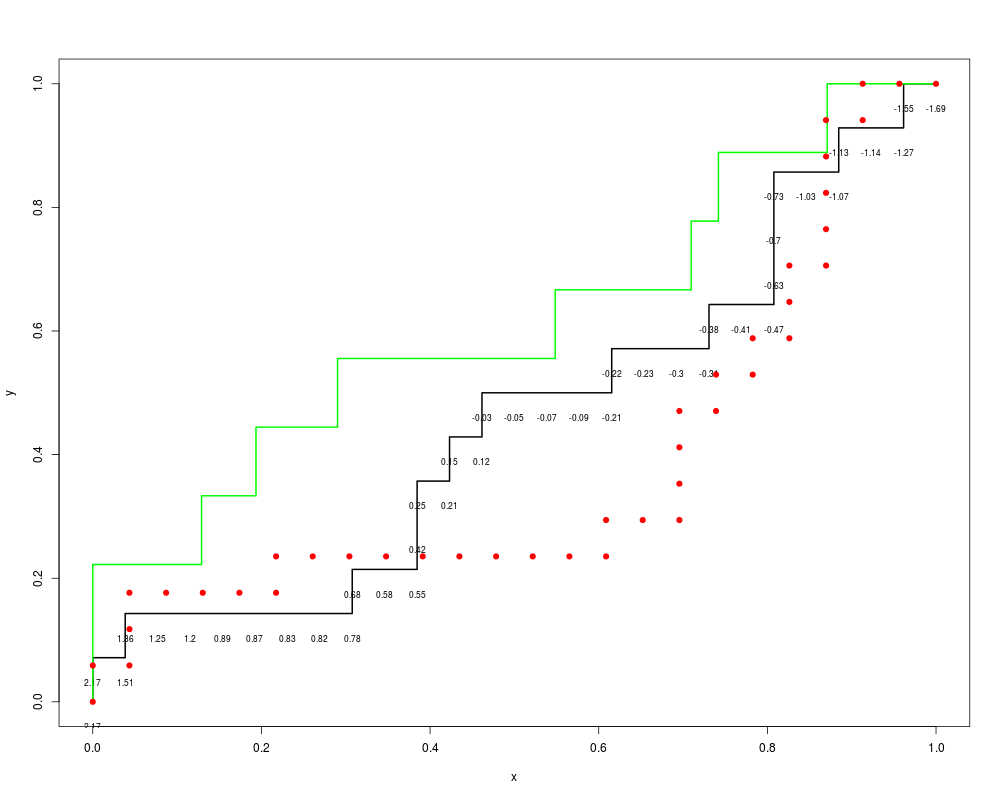
> plot(R1, line=TRUE, show.thresh=TRUE, lwd=2, threshDig=2)
> R2 <- rocdemo.sca( rbinom(40,1,.3), rnorm(40), dxrule.sca,
+ caseLabel="new case", markerLabel="demo Marker" )
NA in cutpts forces recomputation using smallest gap
> plot(R2, line=TRUE, add=TRUE, col="green", lwd=2 )
> R3 <- rocdemo.sca( rbinom(40,1,.4), rnorm(40), dxrule.sca,
+ caseLabel="new case", markerLabel="demo Marker" )
NA in cutpts forces recomputation using smallest gap
> points(R3, col="red", pch=19)
>
>
>
>
>
> dev.off()
null device
1
>
 .
.