Supported by Dr. Osamu Ogasawara and  . . |
|
Last data update: 2014.03.03 |
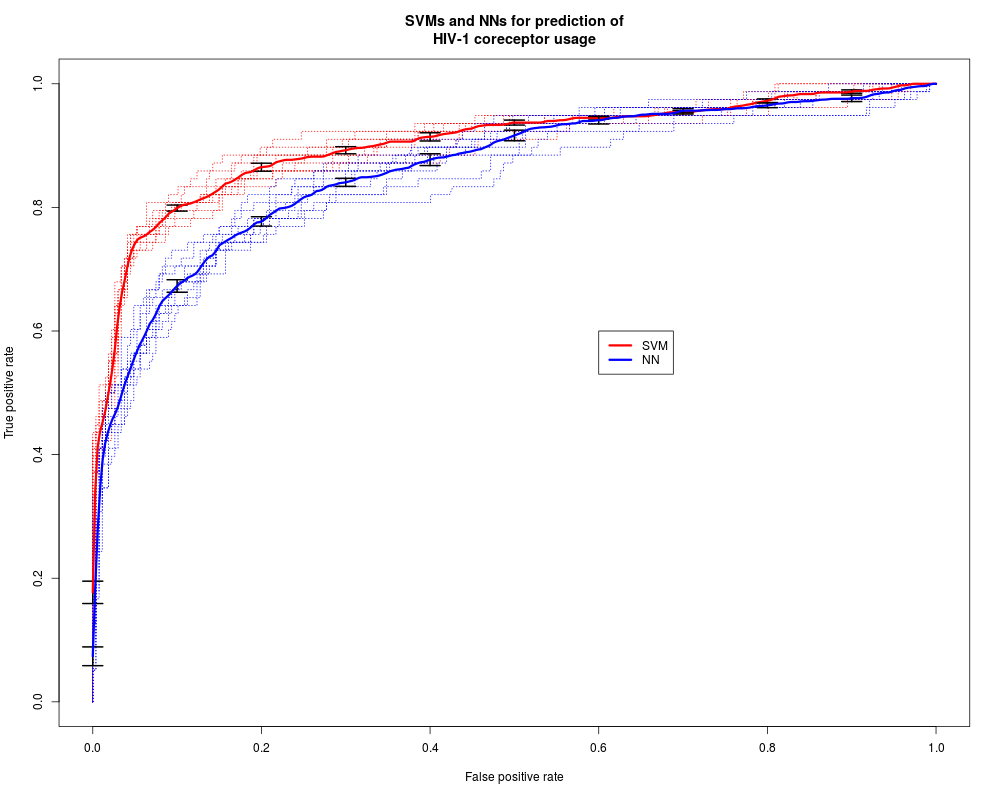
Data set: Support vector machines and neural networks applied to the prediction of HIV-1 coreceptor usageDescriptionLinear support vector machines (libsvm) and neural networks (R package nnet) were applied to predict usage of the coreceptors CCR5 and CXCR4 based on sequence data of the third variable loop of the HIV envelope protein. Usagedata(ROCR.hiv) FormatA list consisting of the SVM ( ReferencesSing, T. & Beerenwinkel, N. & Lengauer, T. "Learning mixtures of localized rules by maximizing the area under the ROC curve". 1st International Workshop on ROC Analysis in AI, 89-96, 2004. Examples
data(ROCR.hiv)
attach(ROCR.hiv)
pred.svm <- prediction(hiv.svm$predictions, hiv.svm$labels)
perf.svm <- performance(pred.svm, 'tpr', 'fpr')
pred.nn <- prediction(hiv.nn$predictions, hiv.svm$labels)
perf.nn <- performance(pred.nn, 'tpr', 'fpr')
plot(perf.svm, lty=3, col="red",main="SVMs and NNs for prediction of
HIV-1 coreceptor usage")
plot(perf.nn, lty=3, col="blue",add=TRUE)
plot(perf.svm, avg="vertical", lwd=3, col="red",
     spread.estimate="stderror",plotCI.lwd=2,add=TRUE)
plot(perf.nn, avg="vertical", lwd=3, col="blue",
spread.estimate="stderror",plotCI.lwd=2,add=TRUE)
legend(0.6,0.6,c('SVM','NN'),col=c('red','blue'),lwd=3)
Results
R version 3.3.1 (2016-06-21) -- "Bug in Your Hair"
Copyright (C) 2016 The R Foundation for Statistical Computing
Platform: x86_64-pc-linux-gnu (64-bit)

R is free software and comes with ABSOLUTELY NO WARRANTY.
You are welcome to redistribute it under certain conditions.
Type 'license()' or 'licence()' for distribution details.

R is a collaborative project with many contributors.
Type 'contributors()' for more information and
'citation()' on how to cite R or R packages in publications.

Type 'demo()' for some demos, 'help()' for on-line help, or
'help.start()' for an HTML browser interface to help.
Type 'q()' to quit R.

> library(ROCR)
Loading required package: gplots

Attaching package: 'gplots'

The following object is masked from 'package:stats':

    lowess

> png(filename="/home/ddbj/snapshot/RGM3/R_CC/result/ROCR/ROCR.hiv.Rd_%03d_medium.png", width=480, height=480)
> ### Name: ROCR.hiv
> ### Title: Data set: Support vector machines and neural networks applied to
> ###   the prediction of HIV-1 coreceptor usage
> ### Aliases: ROCR.hiv
> ### Keywords: datasets
>
> ### ** Examples
>
> data(ROCR.hiv)
> attach(ROCR.hiv)
> pred.svm <- prediction(hiv.svm$predictions, hiv.svm$labels)
> perf.svm <- performance(pred.svm, 'tpr', 'fpr')
> pred.nn <- prediction(hiv.nn$predictions, hiv.svm$labels)
> perf.nn <- performance(pred.nn, 'tpr', 'fpr')
> plot(perf.svm, lty=3, col="red",main="SVMs and NNs for prediction of
+ HIV-1 coreceptor usage")
> plot(perf.nn, lty=3, col="blue",add=TRUE)
> plot(perf.svm, avg="vertical", lwd=3, col="red",
+      spread.estimate="stderror",plotCI.lwd=2,add=TRUE)
> plot(perf.nn, avg="vertical", lwd=3, col="blue",
+ spread.estimate="stderror",plotCI.lwd=2,add=TRUE)
> legend(0.6,0.6,c('SVM','NN'),col=c('red','blue'),lwd=3)
>
>
>
>
>
> dev.off()
null device
          1
>
|
Created & Maintained by Osamu Ogasawara (osamu.ogasawara@gmail.com) and 