Supported by Dr. Osamu Ogasawara and  . . |
|
Last data update: 2014.03.03 |
Data set: Artificial cross-validation data for use with ROCRDescriptionA mock data set containing 10 sets of predictions and corresponding labels as would be obtained from 10-fold cross-validation. Usagedata(ROCR.xval) FormatA two element list. The first element,
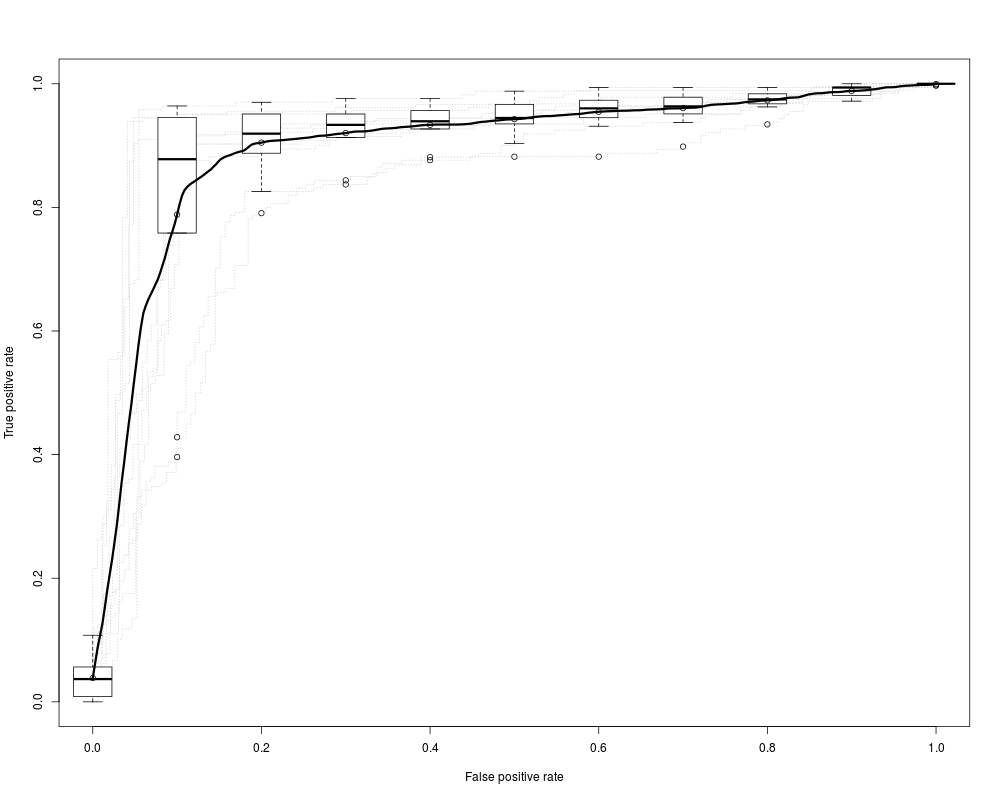
Examples# plot ROC curves for several cross-validation runs (dotted # in grey), overlaid by the vertical average curve and boxplots # showing the vertical spread around the average. data(ROCR.xval) pred <- prediction(ROCR.xval$predictions, ROCR.xval$labels) perf <- performance(pred,"tpr","fpr") plot(perf,col="grey82",lty=3) plot(perf,lwd=3,avg="vertical",spread.estimate="boxplot",add=TRUE) Results
R version 3.3.1 (2016-06-21) -- "Bug in Your Hair"
Copyright (C) 2016 The R Foundation for Statistical Computing
Platform: x86_64-pc-linux-gnu (64-bit)

R is free software and comes with ABSOLUTELY NO WARRANTY.
You are welcome to redistribute it under certain conditions.
Type 'license()' or 'licence()' for distribution details.

R is a collaborative project with many contributors.
Type 'contributors()' for more information and
'citation()' on how to cite R or R packages in publications.

Type 'demo()' for some demos, 'help()' for on-line help, or
'help.start()' for an HTML browser interface to help.
Type 'q()' to quit R.

> library(ROCR)
Loading required package: gplots

Attaching package: 'gplots'

The following object is masked from 'package:stats':

    lowess

> png(filename="/home/ddbj/snapshot/RGM3/R_CC/result/ROCR/ROCR.xval.Rd_%03d_medium.png", width=480, height=480)
> ### Name: ROCR.xval
> ### Title: Data set: Artificial cross-validation data for use with ROCR
> ### Aliases: ROCR.xval
> ### Keywords: datasets
>
> ### ** Examples
>
> # plot ROC curves for several cross-validation runs (dotted
> # in grey), overlaid by the vertical average curve and boxplots
> # showing the vertical spread around the average.
> data(ROCR.xval)
> pred <- prediction(ROCR.xval$predictions, ROCR.xval$labels)
> perf <- performance(pred,"tpr","fpr")
> plot(perf,col="grey82",lty=3)
> plot(perf,lwd=3,avg="vertical",spread.estimate="boxplot",add=TRUE)
>
>
>
>
>
> dev.off()
null device
          1
>
|
Created & Maintained by Osamu Ogasawara (osamu.ogasawara@gmail.com) and 