Supported by Dr. Osamu Ogasawara and  . . |
|
Last data update: 2014.03.03 |
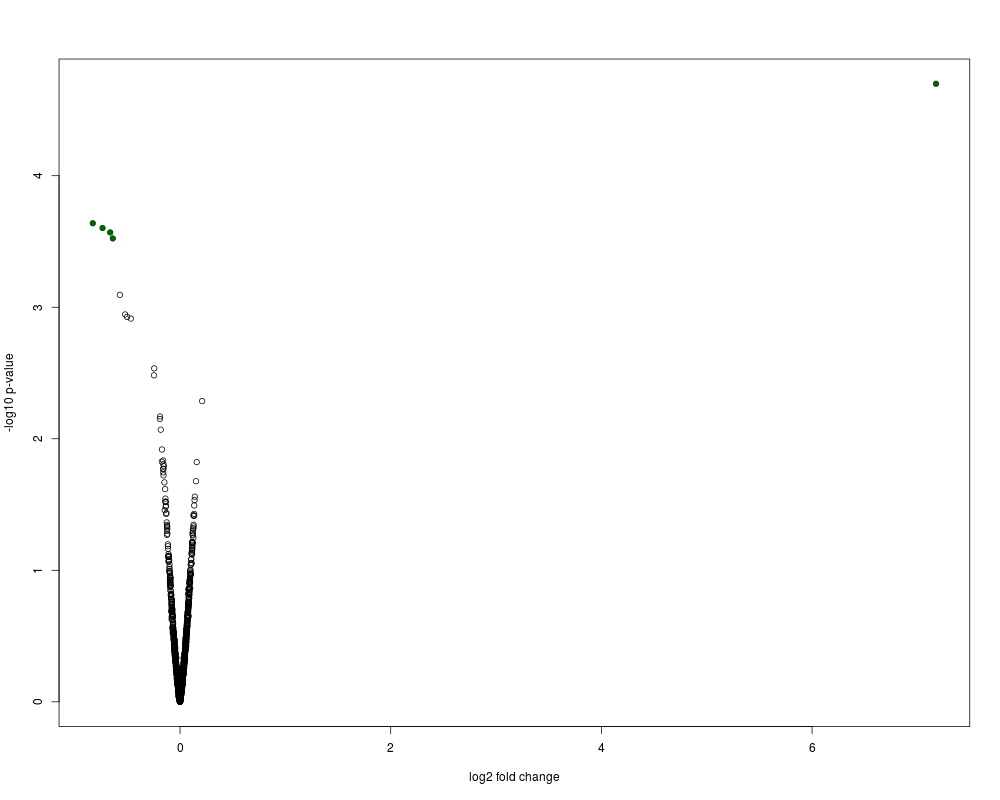
Plotting of a ROTS objectDescriptionPlots the ROTS objects created with the ROTS package. Usage## S3 method for class 'ROTS' plot(x, fdr=0.05, type="volcano", ...) Arguments
DetailsThis function plots the results from a ROTS object using given false discovery rate threshold. ValuePlots the results from ROTS object. Author(s)Fatemeh Seyednasrollah, Tomi Suomi, Laura L. Elo Maintainer: Fatemeh Seyednasrollah <fatsey@utu.fi> See Also
Examples
  ## ROTS-statistic for the Affymetrix spike-in data.
  rots.out <- ROTS(data = affySpikeIn, groups = c(rep(0,5), rep(1,5)),
      B = 100, K = 500 , seed = 1234)
  ## Plotting of the ROTS results.
  plot(rots.out)
Results
R version 3.3.1 (2016-06-21) -- "Bug in Your Hair"
Copyright (C) 2016 The R Foundation for Statistical Computing
Platform: x86_64-pc-linux-gnu (64-bit)

R is free software and comes with ABSOLUTELY NO WARRANTY.
You are welcome to redistribute it under certain conditions.
Type 'license()' or 'licence()' for distribution details.

R is a collaborative project with many contributors.
Type 'contributors()' for more information and
'citation()' on how to cite R or R packages in publications.

Type 'demo()' for some demos, 'help()' for on-line help, or
'help.start()' for an HTML browser interface to help.
Type 'q()' to quit R.

> library(ROTS)
> png(filename="/home/ddbj/snapshot/RGM3/R_BC/result/ROTS/plot.ROTS.Rd_%03d_medium.png", width=480, height=480)
> ### Name: plot.ROTS
> ### Title: Plotting of a ROTS object
> ### Aliases: plot.ROTS
> ### Keywords: math
>
> ### ** Examples
>
>   ## ROTS-statistic for the Affymetrix spike-in data.
>   rots.out <- ROTS(data = affySpikeIn, groups = c(rep(0,5), rep(1,5)),
+       B = 100, K = 500 , seed = 1234)
Bootstrapping samples
Optimizing parameters
Calculating p-values
Calculating FDR
>   ## Plotting of the ROTS results.
>   plot(rots.out)
>
>
>
>
>
> dev.off()
null device
          1
>
|
Created & Maintained by Osamu Ogasawara (osamu.ogasawara@gmail.com) and 