Supported by Dr. Osamu Ogasawara and  . . |
|
Last data update: 2014.03.03 |
Create Boxplots for TCGA DatasetsDescriptionFunction creates boxplots (geom_boxplot) for TCGA Datasets. UsageboxplotTCGA(data, x, y, fill = x, coord.flip = TRUE, facet.names = NULL, ylab = y, xlab = x, legend.title = xlab, legend = "top", ...) Arguments
IssuesIf you have any problems, issues or think that something is missing or is not clear please post an issue on https://github.com/RTCGA/RTCGA/issues. Author(s)Marcin Kosinski, m.p.kosinski@gmail.com See AlsoRTCGA website http://rtcga.github.io/RTCGA/Visualizations.html. Other RTCGA: Examples
library(RTCGA.rnaseq)
# perfrom plot
library(dplyr)
expressionsTCGA(ACC.rnaseq, BLCA.rnaseq, BRCA.rnaseq, OV.rnaseq,
extract.cols = "MET|4233") %>%
rename(cohort = dataset,
MET = `MET|4233`) %>%
#cancer samples
filter(substr(bcr_patient_barcode, 14, 15) == "01") -> ACC_BLCA_BRCA_OV.rnaseq
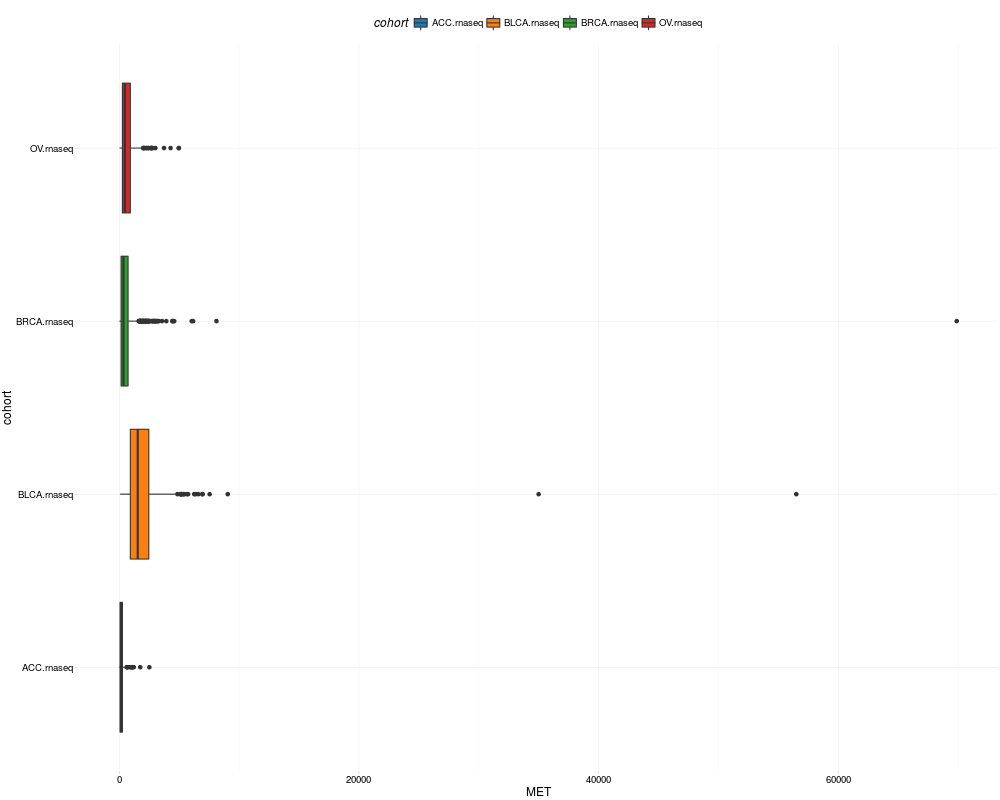
boxplotTCGA(ACC_BLCA_BRCA_OV.rnaseq, "cohort", "MET")
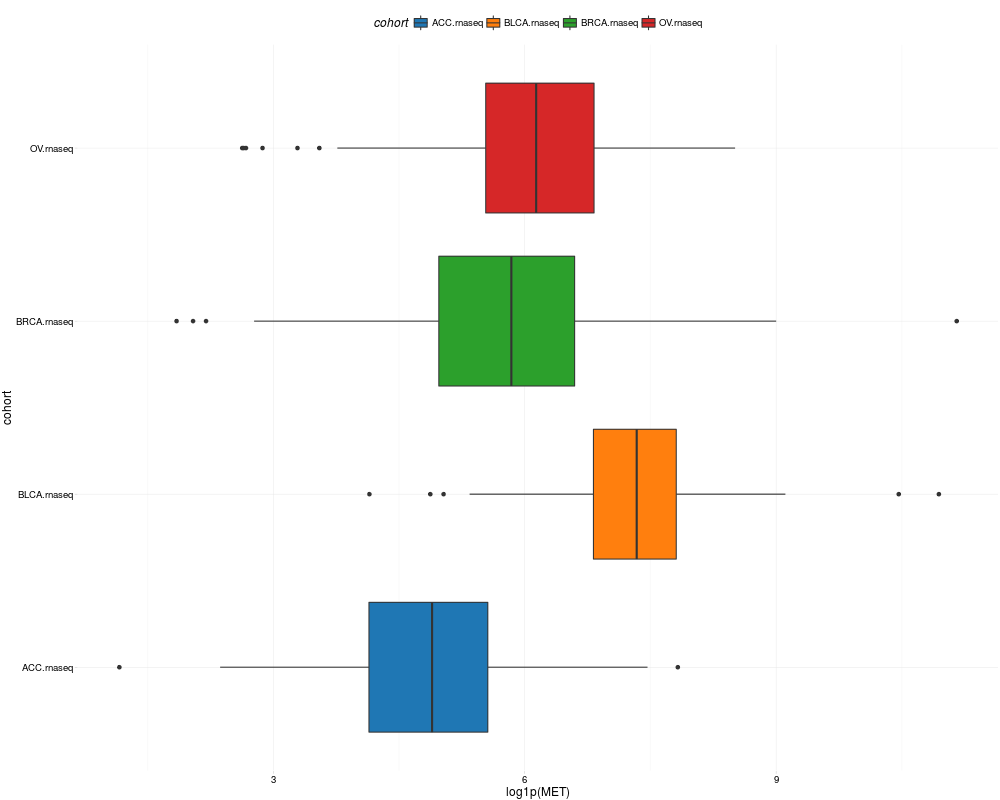
boxplotTCGA(ACC_BLCA_BRCA_OV.rnaseq, "cohort", "log1p(MET)")
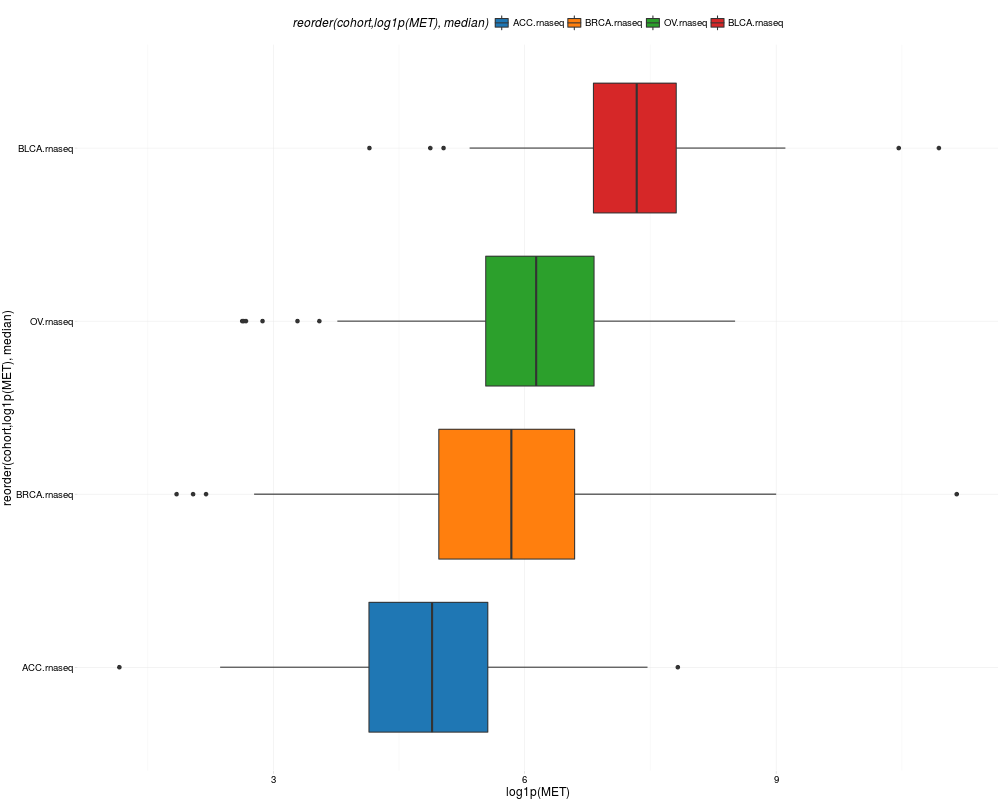
boxplotTCGA(ACC_BLCA_BRCA_OV.rnaseq, "reorder(cohort,log1p(MET), median)", "log1p(MET)")
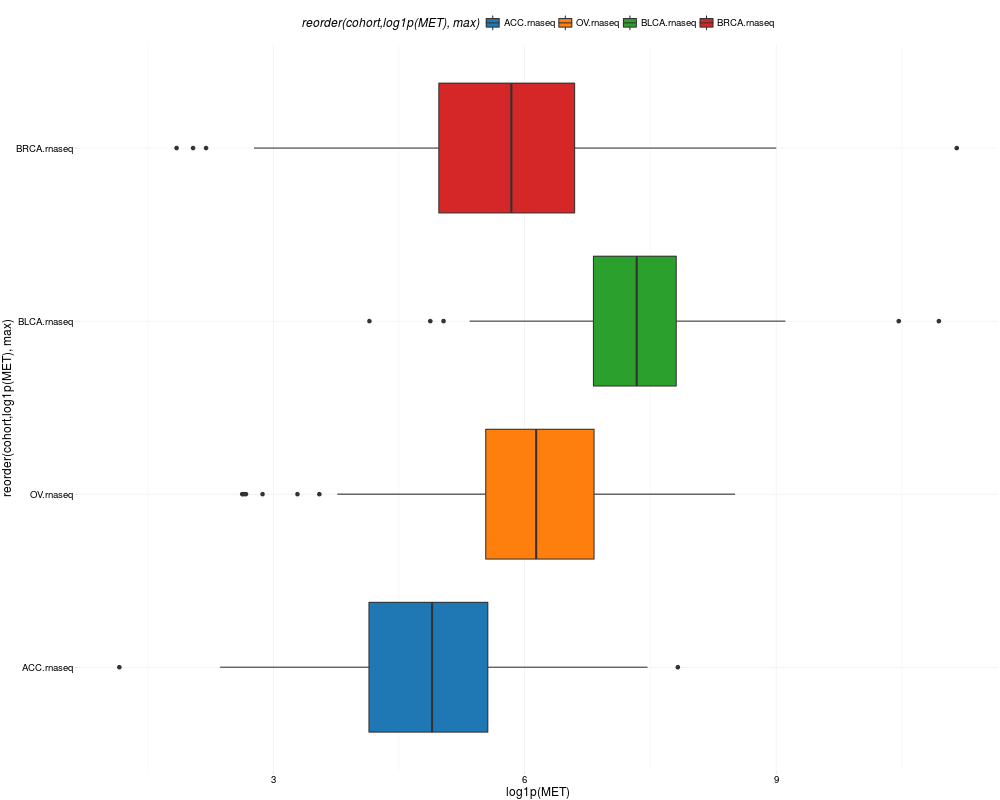
boxplotTCGA(ACC_BLCA_BRCA_OV.rnaseq, "reorder(cohort,log1p(MET), max)", "log1p(MET)")
boxplotTCGA(ACC_BLCA_BRCA_OV.rnaseq, "reorder(cohort,log1p(MET), median)", "log1p(MET)",
xlab = "Cohort Type", ylab = "Logarithm of MET")
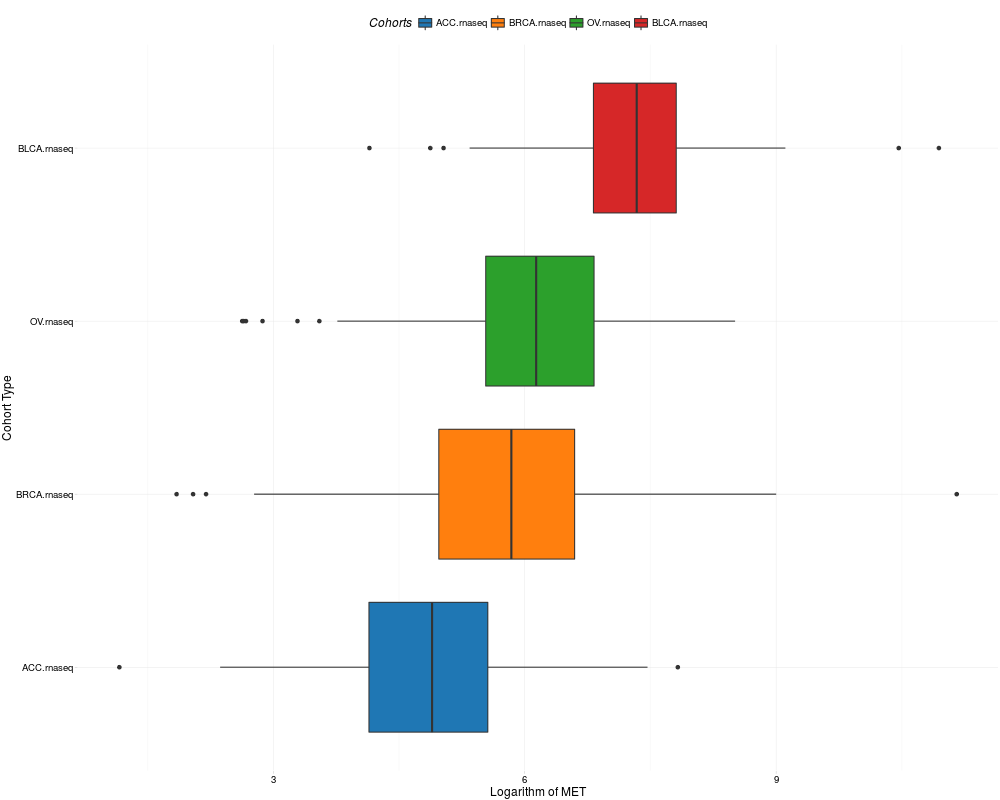
boxplotTCGA(ACC_BLCA_BRCA_OV.rnaseq, "reorder(cohort,log1p(MET), median)", "log1p(MET)",
xlab = "Cohort Type", ylab = "Logarithm of MET", legend.title = "Cohorts")
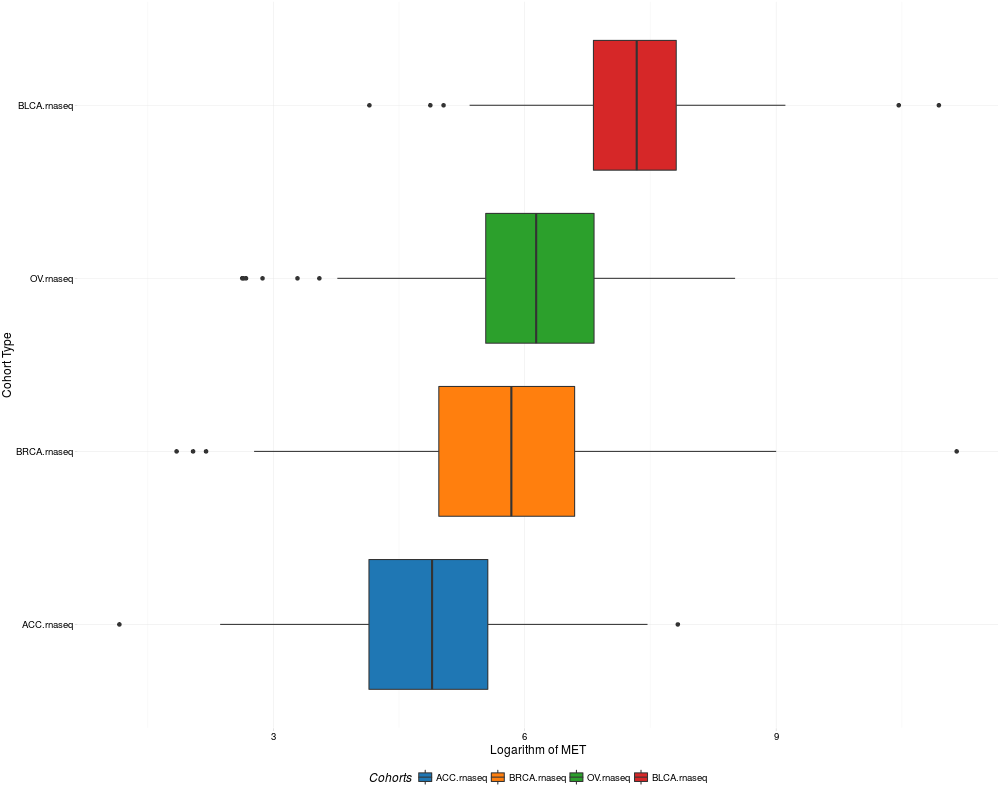
boxplotTCGA(ACC_BLCA_BRCA_OV.rnaseq, "reorder(cohort,log1p(MET), median)", "log1p(MET)",
xlab = "Cohort Type", ylab = "Logarithm of MET", legend.title = "Cohorts", legend = "bottom")
## facet example
library(RTCGA.mutations)
library(dplyr)
mutationsTCGA(BRCA.mutations, OV.mutations, ACC.mutations, BLCA.mutations) %>%
filter(Hugo_Symbol == 'TP53') %>%
filter(substr(bcr_patient_barcode, 14, 15) == "01") %>% # cancer tissue
mutate(bcr_patient_barcode = substr(bcr_patient_barcode, 1, 12)) -> ACC_BLCA_BRCA_OV.mutations
mutationsTCGA(BRCA.mutations, OV.mutations, ACC.mutations, BLCA.mutations) -> ACC_BLCA_BRCA_OV.mutations_all
ACC_BLCA_BRCA_OV.rnaseq %>%
mutate(bcr_patient_barcode = substr(bcr_patient_barcode, 1, 15)) %>%
filter(bcr_patient_barcode %in%
substr(ACC_BLCA_BRCA_OV.mutations_all$bcr_patient_barcode, 1, 15)) %>%
# took patients for which we had any mutation information
# so avoided patients without any information about mutations
mutate(bcr_patient_barcode = substr(bcr_patient_barcode, 1, 12)) %>%
# strin_length(ACC_BLCA_BRCA_OV.mutations$bcr_patient_barcode) == 12
left_join(ACC_BLCA_BRCA_OV.mutations,
by = "bcr_patient_barcode") %>% #joined only with tumor patients
mutate(TP53 = ifelse(!is.na(Variant_Classification), "Mut", "WILD")) %>%
select(cohort, MET, TP53) -> ACC_BLCA_BRCA_OV.rnaseq_TP53mutations
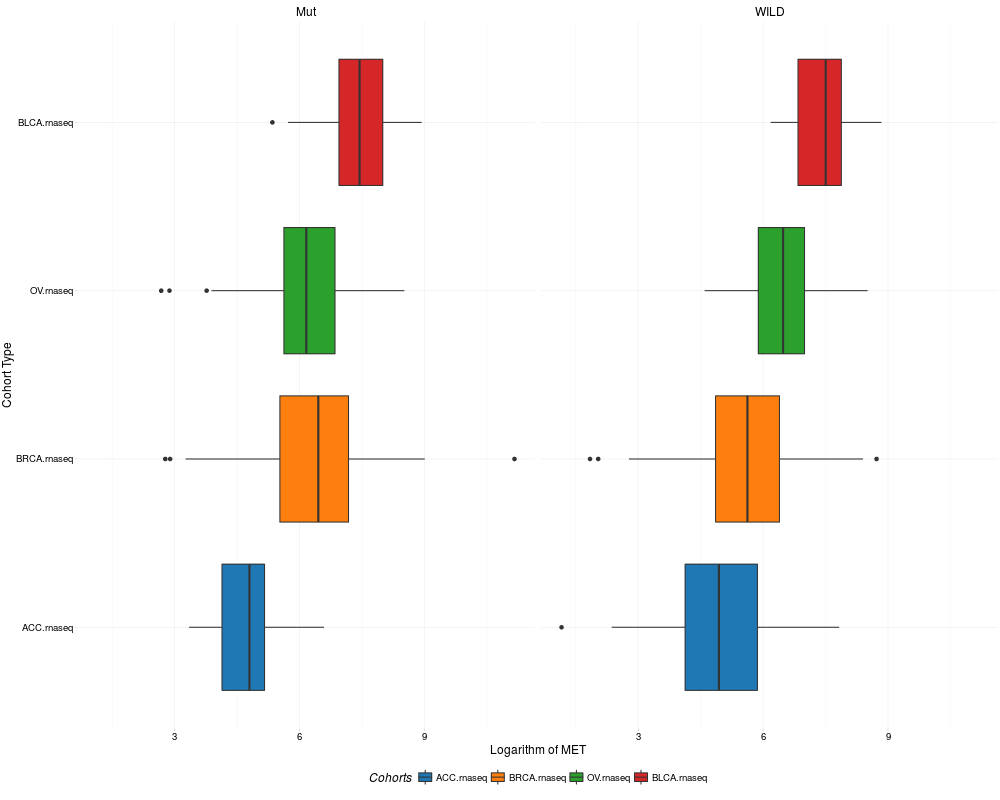
boxplotTCGA(ACC_BLCA_BRCA_OV.rnaseq_TP53mutations,
"reorder(cohort,log1p(MET), median)", "log1p(MET)",
xlab = "Cohort Type", ylab = "Logarithm of MET",
legend.title = "Cohorts", legend = "bottom",
facet.names = c("TP53"))
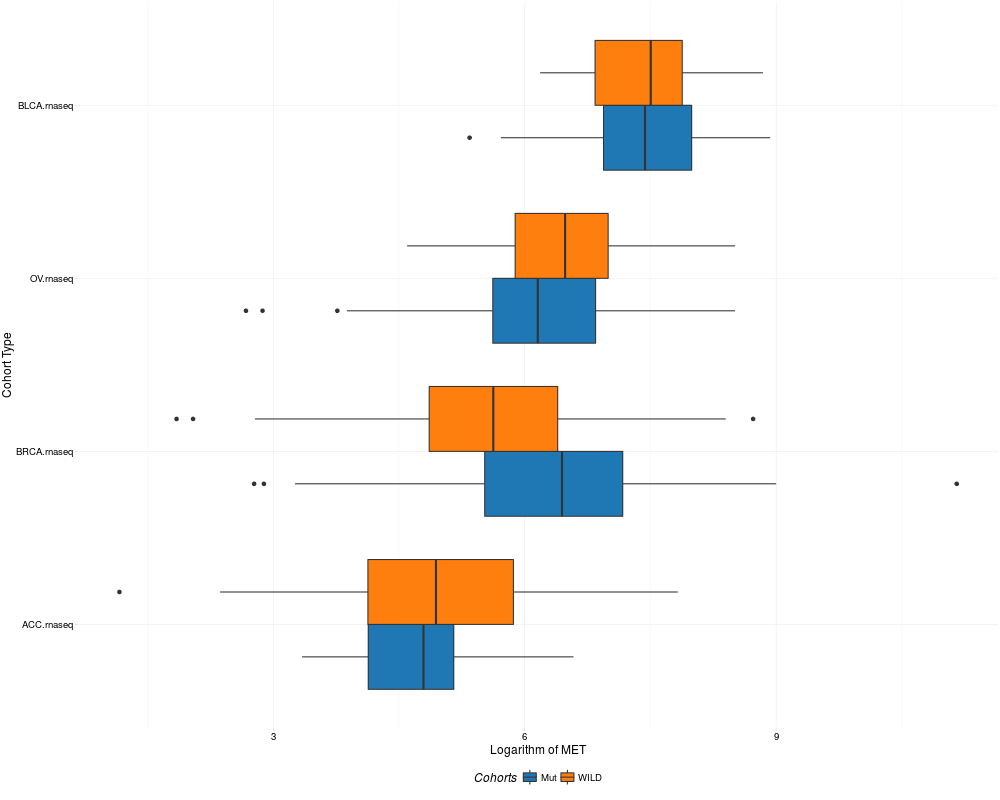
boxplotTCGA(ACC_BLCA_BRCA_OV.rnaseq_TP53mutations,
"reorder(cohort,log1p(MET), median)", "log1p(MET)",
xlab = "Cohort Type", ylab = "Logarithm of MET",
legend.title = "Cohorts", legend = "bottom",
fill = c("TP53"))
Results
R version 3.3.1 (2016-06-21) -- "Bug in Your Hair"
Copyright (C) 2016 The R Foundation for Statistical Computing
Platform: x86_64-pc-linux-gnu (64-bit)

R is free software and comes with ABSOLUTELY NO WARRANTY.
You are welcome to redistribute it under certain conditions.
Type 'license()' or 'licence()' for distribution details.

R is a collaborative project with many contributors.
Type 'contributors()' for more information and
'citation()' on how to cite R or R packages in publications.

Type 'demo()' for some demos, 'help()' for on-line help, or
'help.start()' for an HTML browser interface to help.
Type 'q()' to quit R.

> library(RTCGA)
Welcome to the RTCGA (version: 1.2.2).
> png(filename="/home/ddbj/snapshot/RGM3/R_BC/result/RTCGA/boxplotTCGA.Rd_%03d_medium.png", width=480, height=480)
> ### Name: boxplotTCGA
> ### Title: Create Boxplots for TCGA Datasets
> ### Aliases: boxplotTCGA
>
> ### ** Examples
>
> library(RTCGA.rnaseq)
> # perfrom plot
> library(dplyr)

Attaching package: 'dplyr'

The following objects are masked from 'package:stats':

    filter, lag

The following objects are masked from 'package:base':

    intersect, setdiff, setequal, union

> expressionsTCGA(ACC.rnaseq, BLCA.rnaseq, BRCA.rnaseq, OV.rnaseq,
+ 	extract.cols = "MET|4233") %>%
+ 	rename(cohort = dataset,
+ 	MET = `MET|4233`) %>%
+ 	#cancer samples
+ 	filter(substr(bcr_patient_barcode, 14, 15) == "01") -> ACC_BLCA_BRCA_OV.rnaseq
>
>
> boxplotTCGA(ACC_BLCA_BRCA_OV.rnaseq, "cohort", "MET")
> boxplotTCGA(ACC_BLCA_BRCA_OV.rnaseq, "cohort", "log1p(MET)")
> boxplotTCGA(ACC_BLCA_BRCA_OV.rnaseq, "reorder(cohort,log1p(MET), median)", "log1p(MET)")
> boxplotTCGA(ACC_BLCA_BRCA_OV.rnaseq, "reorder(cohort,log1p(MET), max)", "log1p(MET)")
> boxplotTCGA(ACC_BLCA_BRCA_OV.rnaseq, "reorder(cohort,log1p(MET), median)", "log1p(MET)",
+ xlab = "Cohort Type", ylab = "Logarithm of MET")
> boxplotTCGA(ACC_BLCA_BRCA_OV.rnaseq, "reorder(cohort,log1p(MET), median)", "log1p(MET)",
+ xlab = "Cohort Type", ylab = "Logarithm of MET", legend.title = "Cohorts")
> boxplotTCGA(ACC_BLCA_BRCA_OV.rnaseq, "reorder(cohort,log1p(MET), median)", "log1p(MET)",
+ xlab = "Cohort Type", ylab = "Logarithm of MET", legend.title = "Cohorts", legend = "bottom")
>
> ## facet example
> library(RTCGA.mutations)
> library(dplyr)
> mutationsTCGA(BRCA.mutations, OV.mutations, ACC.mutations, BLCA.mutations) %>%
+ 	filter(Hugo_Symbol == 'TP53') %>%
+ 	filter(substr(bcr_patient_barcode, 14, 15) == "01") %>% # cancer tissue
+ 	mutate(bcr_patient_barcode = substr(bcr_patient_barcode, 1, 12)) -> ACC_BLCA_BRCA_OV.mutations
>
> mutationsTCGA(BRCA.mutations, OV.mutations, ACC.mutations, BLCA.mutations) -> ACC_BLCA_BRCA_OV.mutations_all
>
> ACC_BLCA_BRCA_OV.rnaseq %>%
+ 	mutate(bcr_patient_barcode = substr(bcr_patient_barcode, 1, 15)) %>%
+ 	filter(bcr_patient_barcode %in%
+ 	substr(ACC_BLCA_BRCA_OV.mutations_all$bcr_patient_barcode, 1, 15)) %>%
+ 	# took patients for which we had any mutation information
+ 	# so avoided patients without any information about mutations
+ 	mutate(bcr_patient_barcode = substr(bcr_patient_barcode, 1, 12)) %>%
+ 	# strin_length(ACC_BLCA_BRCA_OV.mutations$bcr_patient_barcode) == 12
+ 	left_join(ACC_BLCA_BRCA_OV.mutations,
+ 	by = "bcr_patient_barcode") %>% #joined only with tumor patients
+ 	mutate(TP53 = ifelse(!is.na(Variant_Classification), "Mut", "WILD")) %>%
+ 	select(cohort, MET, TP53) -> ACC_BLCA_BRCA_OV.rnaseq_TP53mutations
>
> boxplotTCGA(ACC_BLCA_BRCA_OV.rnaseq_TP53mutations,
+  "reorder(cohort,log1p(MET), median)", "log1p(MET)",
+ xlab = "Cohort Type", ylab = "Logarithm of MET",
+  legend.title = "Cohorts", legend = "bottom",
+ facet.names = c("TP53"))
>
> boxplotTCGA(ACC_BLCA_BRCA_OV.rnaseq_TP53mutations,
+  "reorder(cohort,log1p(MET), median)", "log1p(MET)",
+ xlab = "Cohort Type", ylab = "Logarithm of MET",
+  legend.title = "Cohorts", legend = "bottom",
+ fill = c("TP53"))
>
>
>
>
>
>
>
> dev.off()
null device
          1
>
|