Supported by Dr. Osamu Ogasawara and  . . |
|
Last data update: 2014.03.03 |
Gather Expressions for TCGA DatasetsDescriptionFunction gathers expressions over multiple TCGA datasets and extracts expressions for desired genes. See rnaseq, mRNA, RPPA, miRNASeq, methylation. UsageexpressionsTCGA(..., extract.cols = NULL, extract.names = TRUE) Arguments
IssuesIf you have any problems, issues or think that something is missing or is not clear please post an issue on https://github.com/RTCGA/RTCGA/issues. NoteInput data.frames should contain column Author(s)Marcin Kosinski, m.p.kosinski@gmail.com See AlsoRTCGA website http://rtcga.github.io/RTCGA/Visualizations.html. Other RTCGA: Examples
## for all examples
library(dplyr)
library(tidyr)
library(ggplot2)
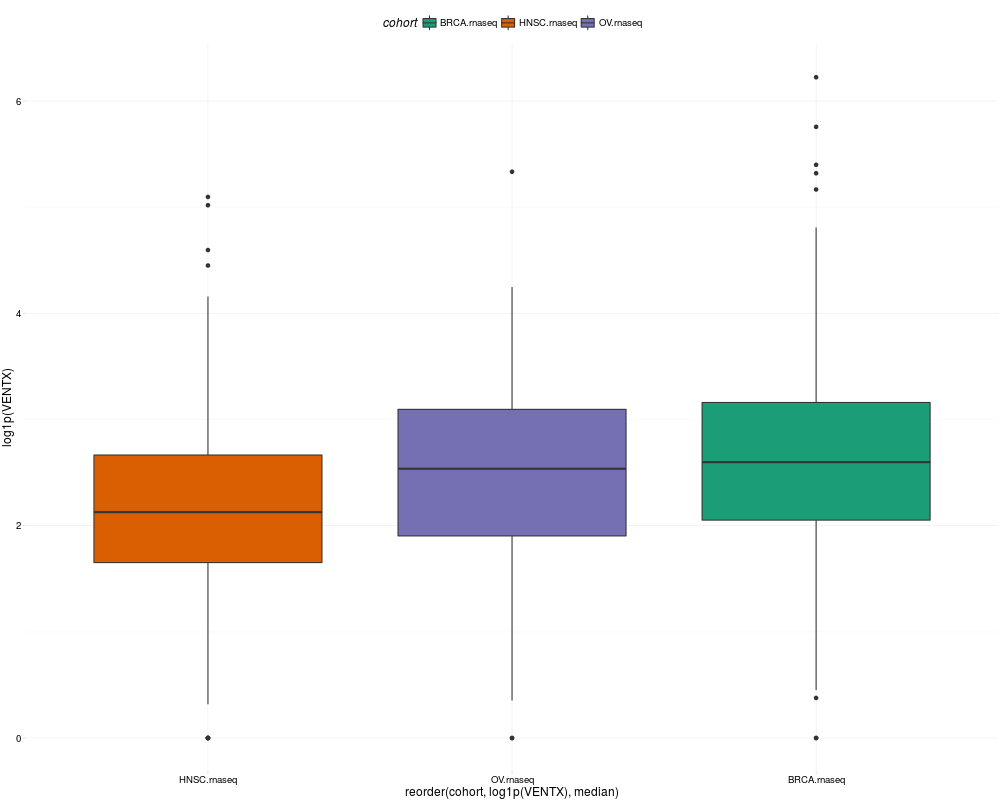
## RNASeq expressions
library(RTCGA.rnaseq)
expressionsTCGA(BRCA.rnaseq, OV.rnaseq, HNSC.rnaseq,
extract.cols = "VENTX|27287") %>%
rename(cohort = dataset,
VENTX = `VENTX|27287`) %>%
filter(substr(bcr_patient_barcode, 14, 15) == "01") %>% #cancer samples
ggplot(aes(y = log1p(VENTX),
x = reorder(cohort, log1p(VENTX), median),
fill = cohort)) +
geom_boxplot() +
theme_RTCGA() +
scale_fill_brewer(palette = "Dark2")
## mRNA expressions
library(tidyr)
library(RTCGA.mRNA)
expressionsTCGA(BRCA.mRNA, COAD.mRNA, LUSC.mRNA, UCEC.mRNA,
extract.cols = c("ARHGAP24", "TRAV20")) %>%
rename(cohort = dataset) %>%
select(-bcr_patient_barcode) %>%
gather(cohort) -> data2plot
names(data2plot)[2] <- "mRNA"
data2plot %>%
ggplot(aes(y = value,
x = reorder(cohort, value, mean),
fill = cohort)) +
geom_boxplot() +
theme_RTCGA() +
scale_fill_brewer(palette = "Set3") +
facet_grid(mRNA~.) +
theme(legend.position = "top")
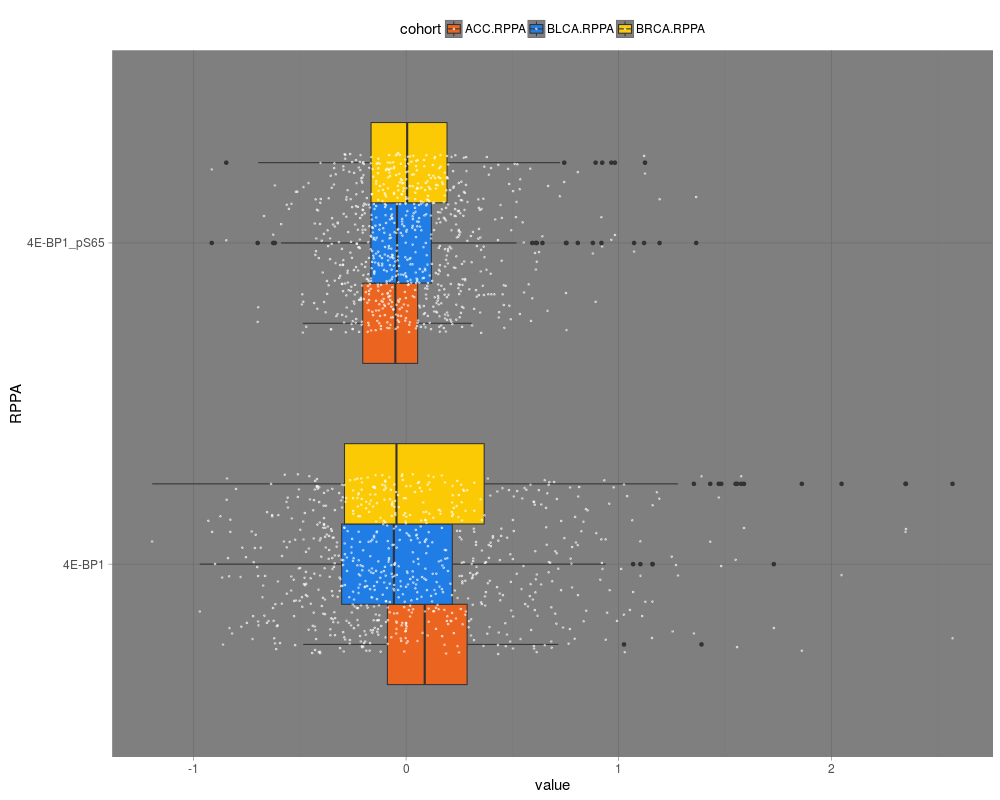
## RPPA expressions
library(RTCGA.RPPA)
expressionsTCGA(ACC.RPPA, BLCA.RPPA, BRCA.RPPA,
extract.cols = c("4E-BP1_pS65", "4E-BP1")) %>%
rename(cohort = dataset) %>%
select(-bcr_patient_barcode) %>%
gather(cohort) -> data2plot
names(data2plot)[2] <- "RPPA"
data2plot %>%
ggplot(aes(fill = cohort,
y = value,
x = RPPA)) +
geom_boxplot() +
theme_dark(base_size = 15) +
scale_fill_manual(values = c("#eb6420", "#207de5", "#fbca04")) +
coord_flip() +
theme(legend.position = "top") +
geom_jitter(alpha = 0.5, col = "white", size = 0.6, width = 0.7)
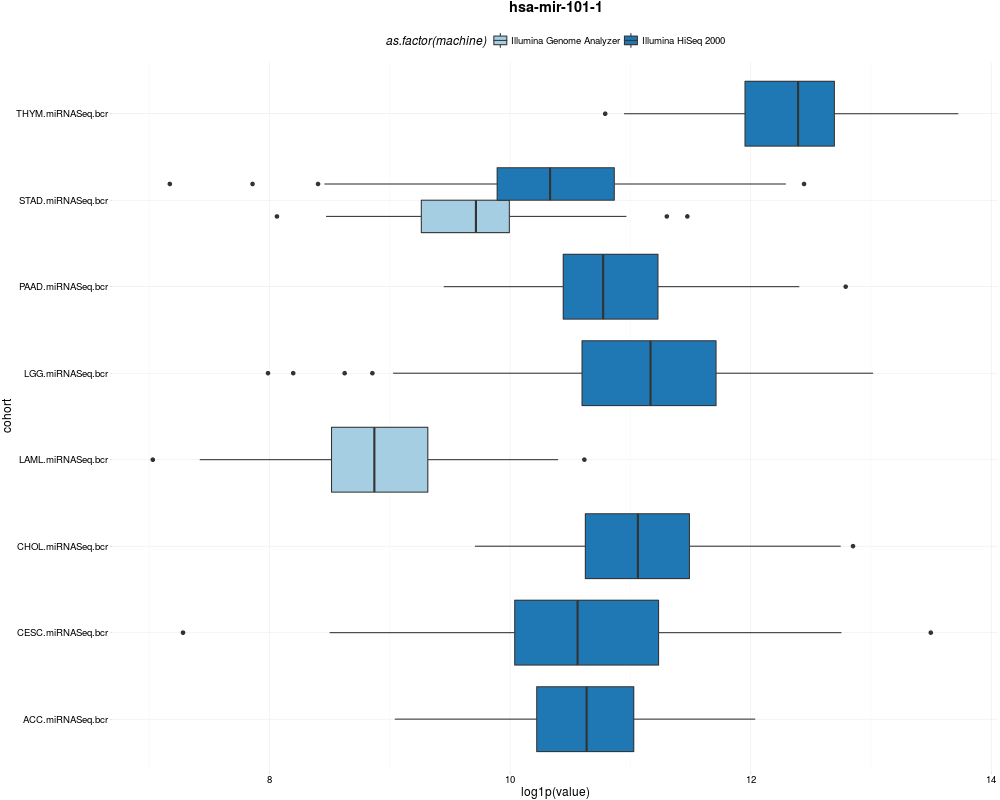
## miRNASeq expressions
library(RTCGA.miRNASeq)
# miRNASeq has bcr_patienct_barcode in rownames...
mutate(ACC.miRNASeq,
bcr_patient_barcode = substr(rownames(ACC.miRNASeq), 1, 25)) -> ACC.miRNASeq.bcr
mutate(CESC.miRNASeq,
bcr_patient_barcode = substr(rownames(CESC.miRNASeq), 1, 25)) -> CESC.miRNASeq.bcr
mutate(CHOL.miRNASeq,
bcr_patient_barcode = substr(rownames(CHOL.miRNASeq), 1, 25)) -> CHOL.miRNASeq.bcr
mutate(LAML.miRNASeq,
bcr_patient_barcode = substr(rownames(LAML.miRNASeq), 1, 25)) -> LAML.miRNASeq.bcr
mutate(PAAD.miRNASeq,
bcr_patient_barcode = substr(rownames(PAAD.miRNASeq), 1, 25)) -> PAAD.miRNASeq.bcr
mutate(THYM.miRNASeq,
bcr_patient_barcode = substr(rownames(THYM.miRNASeq), 1, 25)) -> THYM.miRNASeq.bcr
mutate(LGG.miRNASeq,
bcr_patient_barcode = substr(rownames(LGG.miRNASeq), 1, 25)) -> LGG.miRNASeq.bcr
mutate(STAD.miRNASeq,
bcr_patient_barcode = substr(rownames(STAD.miRNASeq), 1, 25)) -> STAD.miRNASeq.bcr
expressionsTCGA(ACC.miRNASeq.bcr, CESC.miRNASeq.bcr, CHOL.miRNASeq.bcr,
LAML.miRNASeq.bcr, PAAD.miRNASeq.bcr, THYM.miRNASeq.bcr,
LGG.miRNASeq.bcr, STAD.miRNASeq.bcr,
extract.cols = c("machine", "hsa-mir-101-1", "miRNA_ID")) %>%
rename(cohort = dataset) %>%
filter(miRNA_ID == "read_count") %>%
select(-bcr_patient_barcode, -miRNA_ID) %>%
gather(cohort, machine) -> data2plot
names(data2plot)[3:4] <- c("drop","value")
data2plot %>%
select(-drop) %>%
mutate(value = as.numeric(value)) %>%
ggplot(aes(x = cohort,
y = log1p(value),
fill = as.factor(machine)) )+
geom_boxplot() +
theme_RTCGA(base_size = 13) +
coord_flip() +
theme(legend.position = "top") +
scale_fill_brewer(palette = "Paired") +
ggtitle("hsa-mir-101-1")
Results
R version 3.3.1 (2016-06-21) -- "Bug in Your Hair"
Copyright (C) 2016 The R Foundation for Statistical Computing
Platform: x86_64-pc-linux-gnu (64-bit)

R is free software and comes with ABSOLUTELY NO WARRANTY.
You are welcome to redistribute it under certain conditions.
Type 'license()' or 'licence()' for distribution details.

R is a collaborative project with many contributors.
Type 'contributors()' for more information and
'citation()' on how to cite R or R packages in publications.

Type 'demo()' for some demos, 'help()' for on-line help, or
'help.start()' for an HTML browser interface to help.
Type 'q()' to quit R.

> library(RTCGA)
Welcome to the RTCGA (version: 1.2.2).
> png(filename="/home/ddbj/snapshot/RGM3/R_BC/result/RTCGA/expressionsTCGA.Rd_%03d_medium.png", width=480, height=480)
> ### Name: expressionsTCGA
> ### Title: Gather Expressions for TCGA Datasets
> ### Aliases: expressionsTCGA
>
> ### ** Examples
>
>
> ## for all examples
> library(dplyr)

Attaching package: 'dplyr'

The following objects are masked from 'package:stats':

    filter, lag

The following objects are masked from 'package:base':

    intersect, setdiff, setequal, union

> library(tidyr)
> library(ggplot2)
>
> ## RNASeq expressions
> library(RTCGA.rnaseq)
> expressionsTCGA(BRCA.rnaseq, OV.rnaseq, HNSC.rnaseq,
+ 							 extract.cols = "VENTX|27287") %>%
+ 	rename(cohort = dataset,
+ 				 VENTX = `VENTX|27287`) %>%
+  filter(substr(bcr_patient_barcode, 14, 15) == "01") %>% #cancer samples
+ 	ggplot(aes(y = log1p(VENTX),
+ 						 x = reorder(cohort, log1p(VENTX), median),
+ 						 fill = cohort)) +
+ 	geom_boxplot() +
+ 	theme_RTCGA() +
+ 	scale_fill_brewer(palette = "Dark2")
Scale for 'fill' is already present. Adding another scale for 'fill', which
will replace the existing scale.
>
> ## mRNA expressions
> library(tidyr)
> library(RTCGA.mRNA)
> expressionsTCGA(BRCA.mRNA, COAD.mRNA, LUSC.mRNA, UCEC.mRNA,
+ 							 extract.cols = c("ARHGAP24", "TRAV20")) %>%
+ 	rename(cohort = dataset) %>%
+ 	select(-bcr_patient_barcode) %>%
+ 	gather(cohort) -> data2plot
> names(data2plot)[2] <- "mRNA"
> data2plot %>%
+ 	ggplot(aes(y = value,
+ 						 x = reorder(cohort, value, mean),
+ 						 fill = cohort)) +
+ 	geom_boxplot() +
+ 	theme_RTCGA() +
+ 	scale_fill_brewer(palette = "Set3") +
+ 	facet_grid(mRNA~.) +
+ 	theme(legend.position = "top")
Scale for 'fill' is already present. Adding another scale for 'fill', which
will replace the existing scale.
Warning message:
Removed 2 rows containing non-finite values (stat_boxplot).
>
>
> ## RPPA expressions
> library(RTCGA.RPPA)
> expressionsTCGA(ACC.RPPA, BLCA.RPPA, BRCA.RPPA,
+ 		extract.cols = c("4E-BP1_pS65", "4E-BP1")) %>%
+ 	rename(cohort = dataset) %>%
+ 	select(-bcr_patient_barcode) %>%
+ 	gather(cohort) -> data2plot
> names(data2plot)[2] <- "RPPA"
> data2plot %>%
+ 	ggplot(aes(fill = cohort,
+ 						 y = value,
+ 						 x = RPPA)) +
+ 	geom_boxplot() +
+ 	theme_dark(base_size = 15) +
+ 	scale_fill_manual(values = c("#eb6420", "#207de5", "#fbca04")) +
+ 	coord_flip() +
+ 	theme(legend.position = "top") +
+ 	geom_jitter(alpha = 0.5, col = "white", size = 0.6, width = 0.7)
>
>
>
> ## miRNASeq expressions
> library(RTCGA.miRNASeq)
> # miRNASeq has bcr_patienct_barcode in rownames...
> mutate(ACC.miRNASeq,
+    bcr_patient_barcode = substr(rownames(ACC.miRNASeq), 1, 25)) -> ACC.miRNASeq.bcr
> mutate(CESC.miRNASeq,
+    bcr_patient_barcode = substr(rownames(CESC.miRNASeq), 1, 25)) -> CESC.miRNASeq.bcr
> mutate(CHOL.miRNASeq,
+    bcr_patient_barcode = substr(rownames(CHOL.miRNASeq), 1, 25)) -> CHOL.miRNASeq.bcr
> mutate(LAML.miRNASeq,
+    bcr_patient_barcode = substr(rownames(LAML.miRNASeq), 1, 25)) -> LAML.miRNASeq.bcr
> mutate(PAAD.miRNASeq,
+    bcr_patient_barcode = substr(rownames(PAAD.miRNASeq), 1, 25)) -> PAAD.miRNASeq.bcr
> mutate(THYM.miRNASeq,
+    bcr_patient_barcode = substr(rownames(THYM.miRNASeq), 1, 25)) -> THYM.miRNASeq.bcr
> mutate(LGG.miRNASeq,
+    bcr_patient_barcode = substr(rownames(LGG.miRNASeq), 1, 25)) -> LGG.miRNASeq.bcr
> mutate(STAD.miRNASeq,
+    bcr_patient_barcode = substr(rownames(STAD.miRNASeq), 1, 25)) -> STAD.miRNASeq.bcr
>
>
> expressionsTCGA(ACC.miRNASeq.bcr, CESC.miRNASeq.bcr, CHOL.miRNASeq.bcr,
+  					 LAML.miRNASeq.bcr, PAAD.miRNASeq.bcr, THYM.miRNASeq.bcr,
+  					 LGG.miRNASeq.bcr, STAD.miRNASeq.bcr,
+  extract.cols = c("machine", "hsa-mir-101-1", "miRNA_ID")) %>%
+ 							 rename(cohort = dataset) %>%
+ 	filter(miRNA_ID == "read_count") %>%
+ 	select(-bcr_patient_barcode, -miRNA_ID) %>%
+ 	gather(cohort, machine) -> data2plot
> names(data2plot)[3:4] <- c("drop","value")
> data2plot %>%
+ 	select(-drop) %>%
+ 	mutate(value = as.numeric(value)) %>%
+ 	ggplot(aes(x = cohort,
+ 						 y = log1p(value),
+ 						 fill = as.factor(machine)) )+
+ 	geom_boxplot() +
+ theme_RTCGA(base_size = 13) +
+ 	coord_flip() +
+ 	theme(legend.position = "top") +
+ 	scale_fill_brewer(palette = "Paired") +
+ 	ggtitle("hsa-mir-101-1")
Scale for 'fill' is already present. Adding another scale for 'fill', which
will replace the existing scale.
>
>
>
>
>
>
>
> dev.off()
null device
          1
>
|