getReport draws a circle plot into your workin director to show log fold changes for differentially expressed genes, copy number alterations and mutations.
R version 3.3.1 (2016-06-21) -- "Bug in Your Hair"
Copyright (C) 2016 The R Foundation for Statistical Computing
Platform: x86_64-pc-linux-gnu (64-bit)
R is free software and comes with ABSOLUTELY NO WARRANTY.
You are welcome to redistribute it under certain conditions.
Type 'license()' or 'licence()' for distribution details.
R is a collaborative project with many contributors.
Type 'contributors()' for more information and
'citation()' on how to cite R or R packages in publications.
Type 'demo()' for some demos, 'help()' for on-line help, or
'help.start()' for an HTML browser interface to help.
Type 'q()' to quit R.
> library(RTCGAToolbox)
> png(filename="/home/ddbj/snapshot/RGM3/R_BC/result/RTCGAToolbox/getReport.Rd_%03d_medium.png", width=480, height=480)
> ### Name: getReport
> ### Title: Draws a circle plot into working directory
> ### Aliases: getReport
>
> ### ** Examples
>
> data(RTCGASample)
RTCGASample dataset is artificially created for function test.
It isn't biologically meaninful and it has no relation with any cancer type.
For real datasets, please use client function to get data from data portal.
> require("Homo.sapiens")
Loading required package: Homo.sapiens
Loading required package: AnnotationDbi
Loading required package: stats4
Loading required package: BiocGenerics
Loading required package: parallel
Attaching package: 'BiocGenerics'
The following objects are masked from 'package:parallel':
clusterApply, clusterApplyLB, clusterCall, clusterEvalQ,
clusterExport, clusterMap, parApply, parCapply, parLapply,
parLapplyLB, parRapply, parSapply, parSapplyLB
The following objects are masked from 'package:stats':
IQR, mad, xtabs
The following objects are masked from 'package:base':
Filter, Find, Map, Position, Reduce, anyDuplicated, append,
as.data.frame, cbind, colnames, do.call, duplicated, eval, evalq,
get, grep, grepl, intersect, is.unsorted, lapply, lengths, mapply,
match, mget, order, paste, pmax, pmax.int, pmin, pmin.int, rank,
rbind, rownames, sapply, setdiff, sort, table, tapply, union,
unique, unsplit
Loading required package: Biobase
Welcome to Bioconductor
Vignettes contain introductory material; view with
'browseVignettes()'. To cite Bioconductor, see
'citation("Biobase")', and for packages 'citation("pkgname")'.
Loading required package: IRanges
Loading required package: S4Vectors
Attaching package: 'S4Vectors'
The following objects are masked from 'package:base':
colMeans, colSums, expand.grid, rowMeans, rowSums
Loading required package: OrganismDbi
Loading required package: GenomicFeatures
Loading required package: GenomeInfoDb
Loading required package: GenomicRanges
Loading required package: GO.db
Loading required package: org.Hs.eg.db
Loading required package: TxDb.Hsapiens.UCSC.hg19.knownGene
> locations = genes(Homo.sapiens,columns="SYMBOL")
'select()' returned 1:1 mapping between keys and columns
> locations = as.data.frame(locations)
> locations <- locations[,c(6,1,5,2:3)]
> locations <- locations[!is.na(locations[,1]),]
> rownames(locations) <- locations[,1]
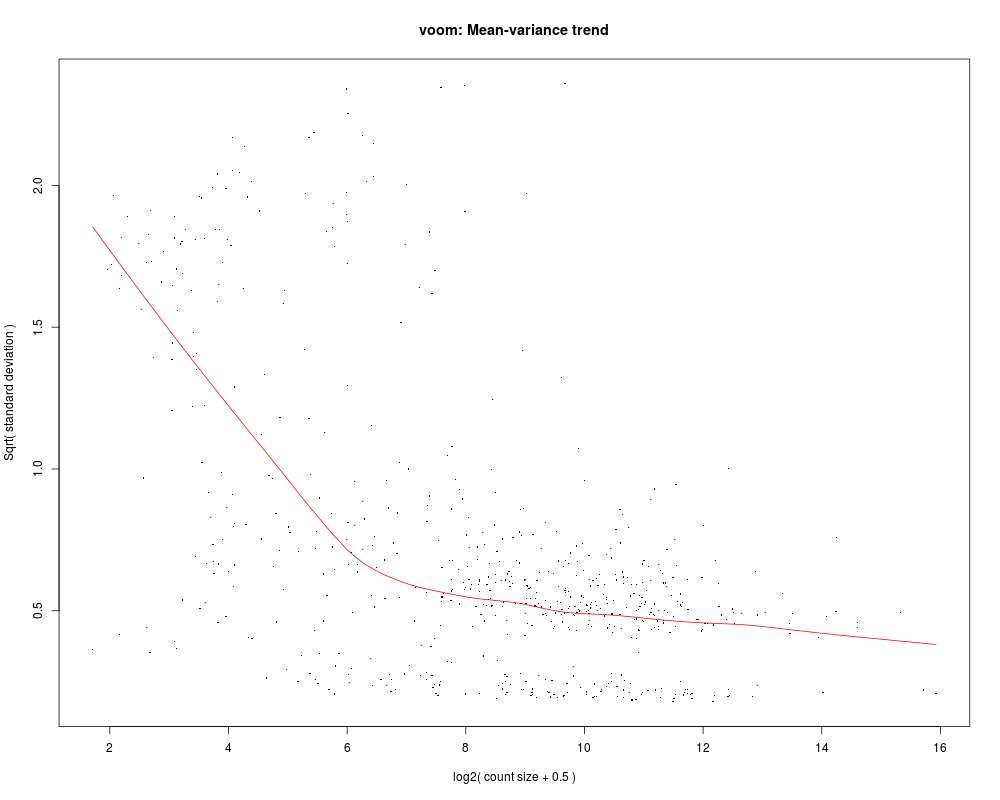
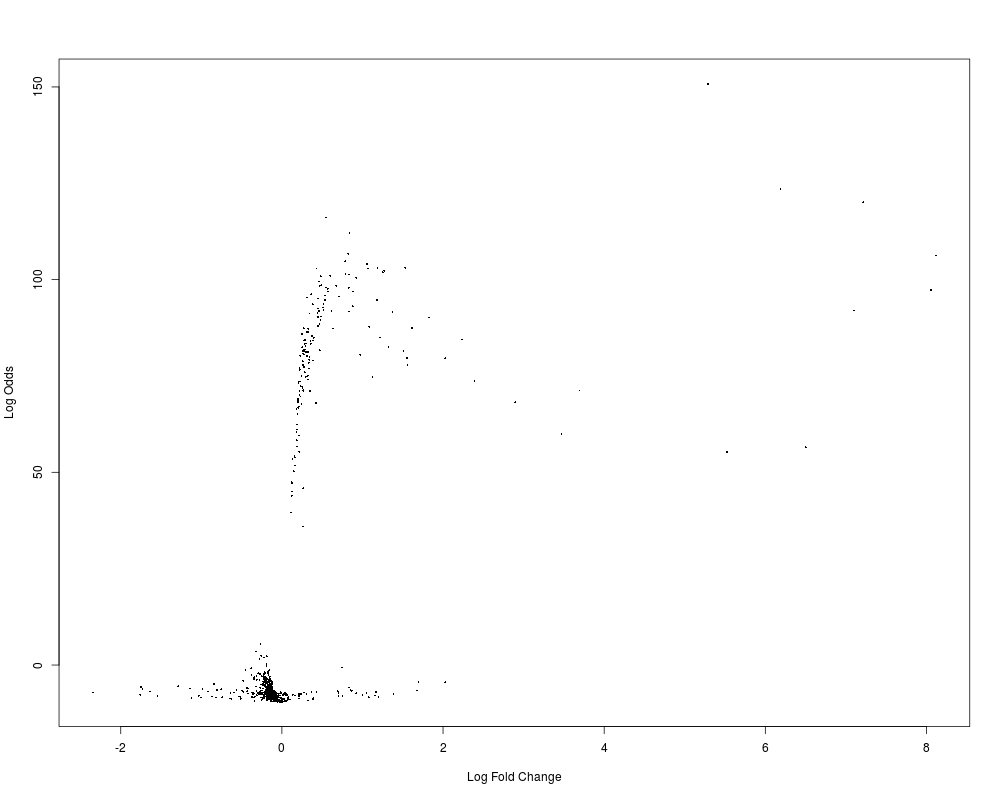
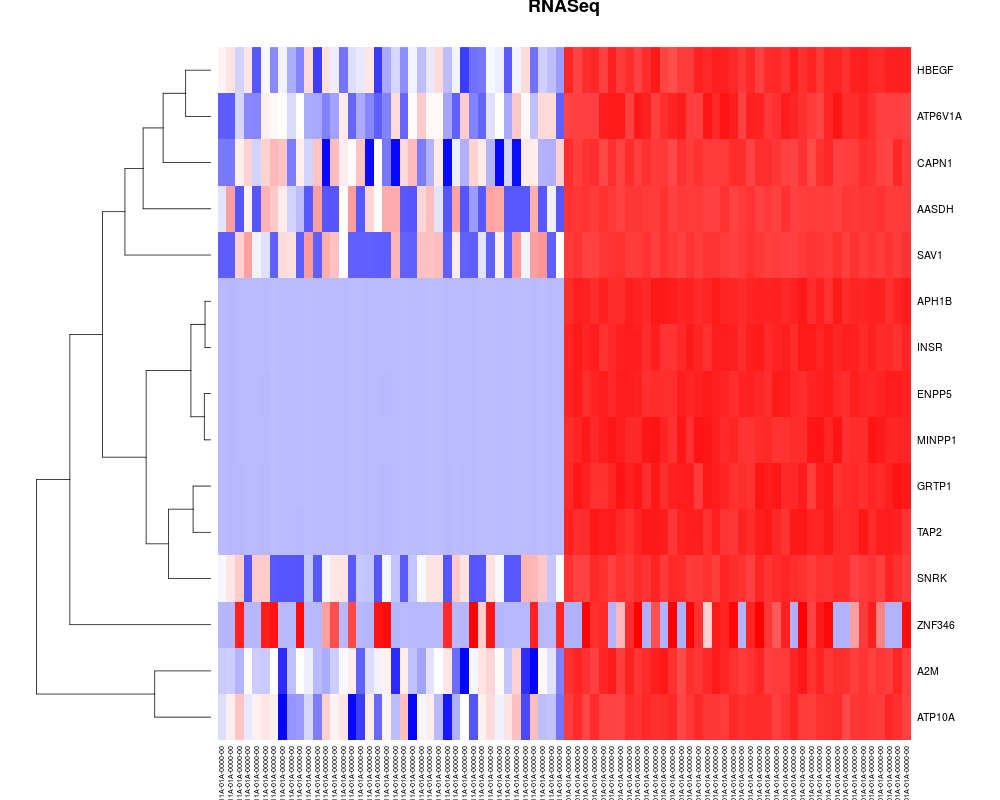
> t1=getDiffExpressedGenes(RTCGASample)
> ## Not run:
> ##D getReport(dataObject=RTCGASample,DGEResult1=t1[[1]],geneLocations=locations)
> ## End(Not run)
>
>
>
>
>
> dev.off()
null device
1
>
 .
.