Can be set as 2 or 3. (Default 2) Order and divide samples into n groups by using gene expression data.
geneSymbols
Gene symbol that is going to be tested
sampleTimeCensor
a data frame that stores clinical data. First column should store sample IDs, second column should have time and third column should have event information. For more information please see vignette.
Value
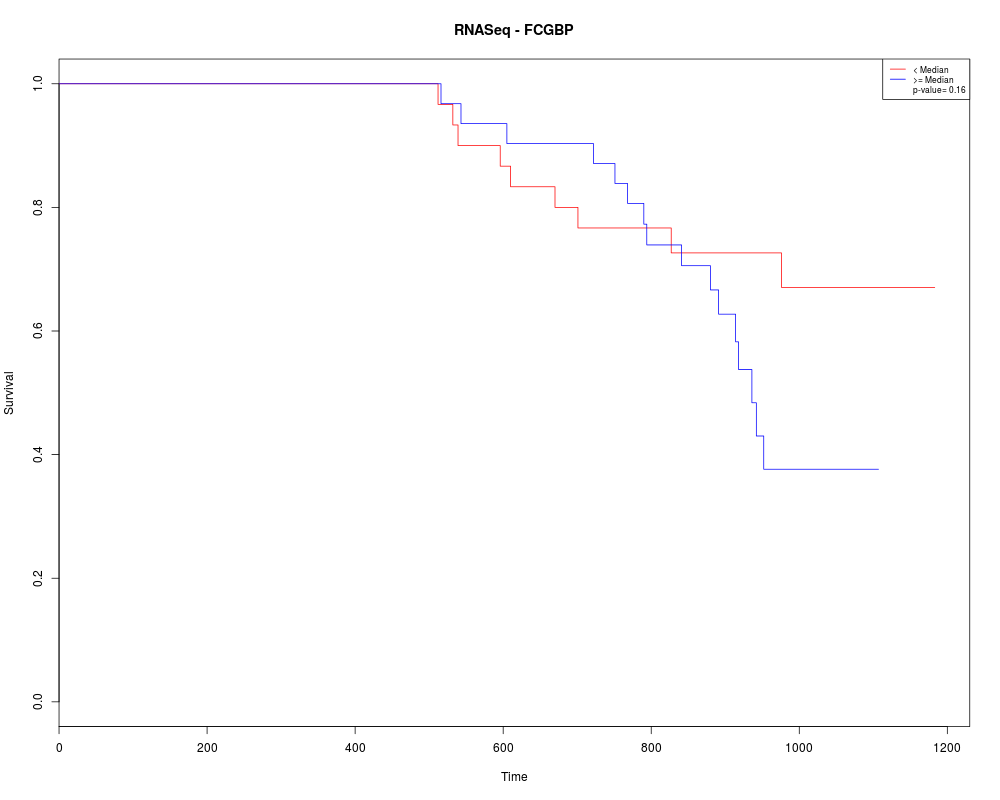
Draws a KM plot
Examples
## get data with  getFirehoseData() function and call survival analysis
## Always check clinical data file for structural changes
data(RTCGASample)
clinicData <- getData(RTCGASample,"Clinical")
clinicData = clinicData[,3:5]
clinicData[is.na(clinicData[,3]),3] = clinicData[is.na(clinicData[,3]),2]
survData <- data.frame(Samples=rownames(clinicData),Time=as.numeric(clinicData[,3]),
Censor=as.numeric(clinicData[,1]))
getSurvival(dataObject=RTCGASample,geneSymbols=c("FCGBP"),sampleTimeCensor=survData)
Results
R version 3.3.1 (2016-06-21) -- "Bug in Your Hair"
Copyright (C) 2016 The R Foundation for Statistical Computing
Platform: x86_64-pc-linux-gnu (64-bit)

R is free software and comes with ABSOLUTELY NO WARRANTY.
You are welcome to redistribute it under certain conditions.
Type 'license()' or 'licence()' for distribution details.

R is a collaborative project with many contributors.
Type 'contributors()' for more information and
'citation()' on how to cite R or R packages in publications.

Type 'demo()' for some demos, 'help()' for on-line help, or
'help.start()' for an HTML browser interface to help.
Type 'q()' to quit R.

> library(RTCGAToolbox)
> png(filename="/home/ddbj/snapshot/RGM3/R_BC/result/RTCGAToolbox/getSurvival.Rd_%03d_medium.png", width=480, height=480)
> ### Name: getSurvival
> ### Title: Perform survival analysis based on gene expression data
> ### Aliases: getSurvival
>
> ### ** Examples
>
> ## get data with  getFirehoseData() function and call survival analysis
> ## Always check clinical data file for structural changes
> data(RTCGASample)
RTCGASample dataset is artificially created for function test.
It isn't biologically meaninful and it has no relation with any cancer type.
For real datasets, please use client function to get data from data portal.
> clinicData <- getData(RTCGASample,"Clinical")
TEST FirehoseData object
Available data types:
Clinical: A data frame, dim: 100	7
RNASeqGene: A matrix withraw read counts or normalized data, dim: 800	80
GISTIC: A FirehoseGISTIC object to store copy number data
Mutations: A data.frame, dim: 2685	30
To export data, you may use getData() function.
> clinicData = clinicData[,3:5]
> clinicData[is.na(clinicData[,3]),3] = clinicData[is.na(clinicData[,3]),2]
> survData <- data.frame(Samples=rownames(clinicData),Time=as.numeric(clinicData[,3]),
+ Censor=as.numeric(clinicData[,1]))
> getSurvival(dataObject=RTCGASample,geneSymbols=c("FCGBP"),sampleTimeCensor=survData)
>
>
>
>
>
> dev.off()
null device
          1
>
 .
.