Supported by Dr. Osamu Ogasawara and  . . |
|
Last data update: 2014.03.03 |
Remove Unwanted Variation Using Control GenesDescriptionThis function implements the RUVg method of Risso et al. (2014). UsageRUVg(x, cIdx, k, drop=0, center=TRUE, round=TRUE, epsilon=1, tolerance=1e-8, isLog=FALSE) Arguments
DetailsThe RUVg procedure performs factor analysis of the read counts based on a suitably-chosen subset of negative control genes known a priori not be differentially expressed (DE) between the samples under consideration. Several types of controls can be used, including housekeeping genes, spike-in sequences (e.g., ERCC), or “in-silico” empirical controls (e.g., least significantly DE genes based on a DE analysis performed prior to RUV normalization). Note that one can relax the negative control gene assumption by requiring instead the identification of a set of positive or negative controls, with a priori known expression fold-changes between samples. RUVg can then simply be applied to control-centered log counts, as detailed in the vignette. Methods
Author(s)Davide Risso ReferencesD. Risso, J. Ngai, T. P. Speed, and S. Dudoit. Normalization of RNA-seq data using factor analysis of control genes or samples. Nature Biotechnology, 2014. (In press). D. Risso, J. Ngai, T. P. Speed, and S. Dudoit. The role of spike-in standards in the normalization of RNA-Seq. In D. Nettleton and S. Datta, editors, Statistical Analysis of Next Generation Sequence Data. Springer, 2014. (In press). See Also
Examples
library(zebrafishRNASeq)
data(zfGenes)
## run on a subset of genes for time reasons
## (real analyses should be performed on all genes)
genes <- rownames(zfGenes)[grep("^ENS", rownames(zfGenes))]
spikes <- rownames(zfGenes)[grep("^ERCC", rownames(zfGenes))]
set.seed(123)
idx <- c(sample(genes, 1000), spikes)
seq <- newSeqExpressionSet(as.matrix(zfGenes[idx,]))
# RUVg normalization
seqRUVg <- RUVg(seq, spikes, k=1)
pData(seqRUVg)
head(normCounts(seqRUVg))
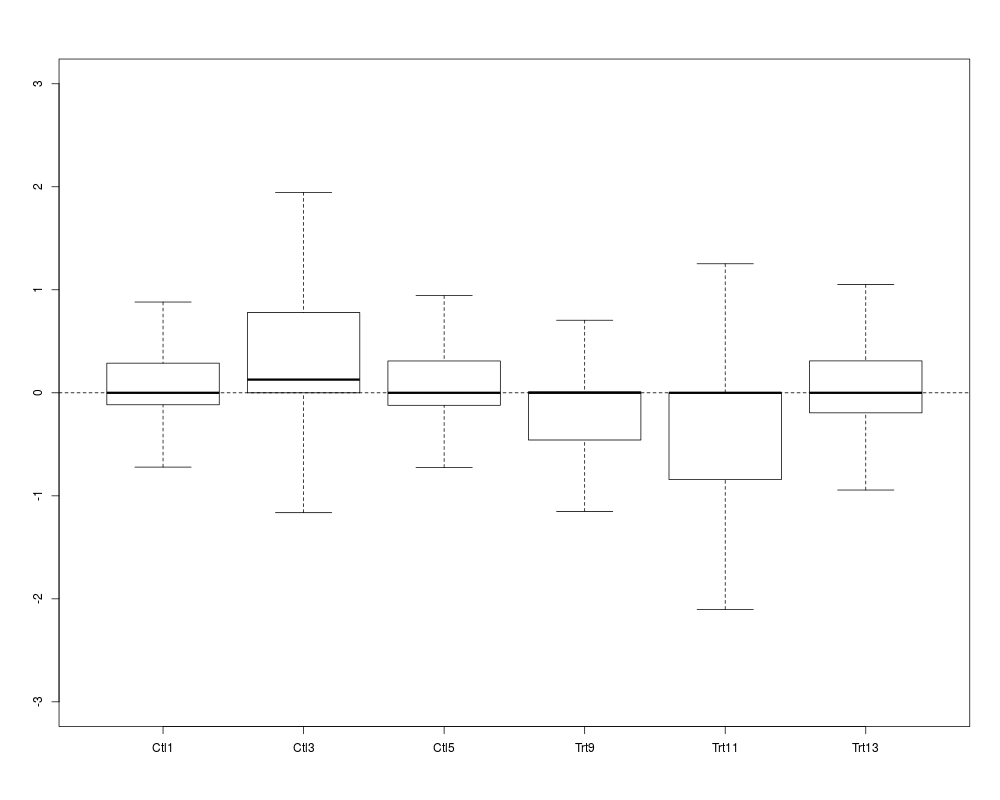
plotRLE(seq, outline=FALSE, ylim=c(-3, 3))
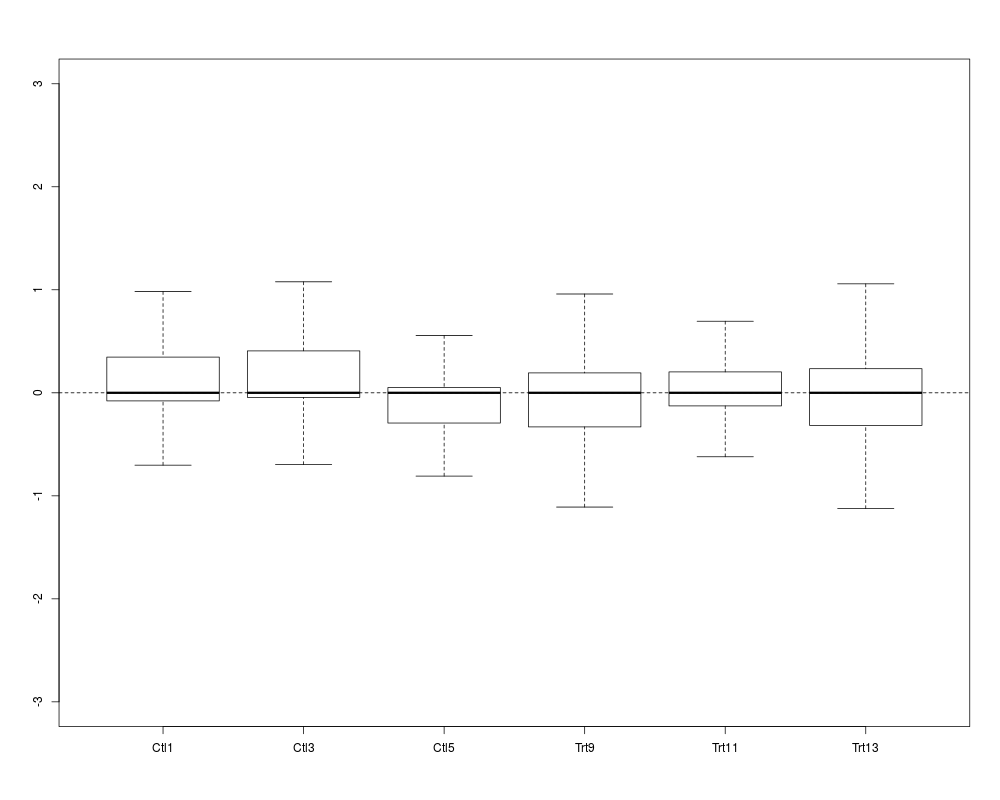
plotRLE(seqRUVg, outline=FALSE, ylim=c(-3, 3))
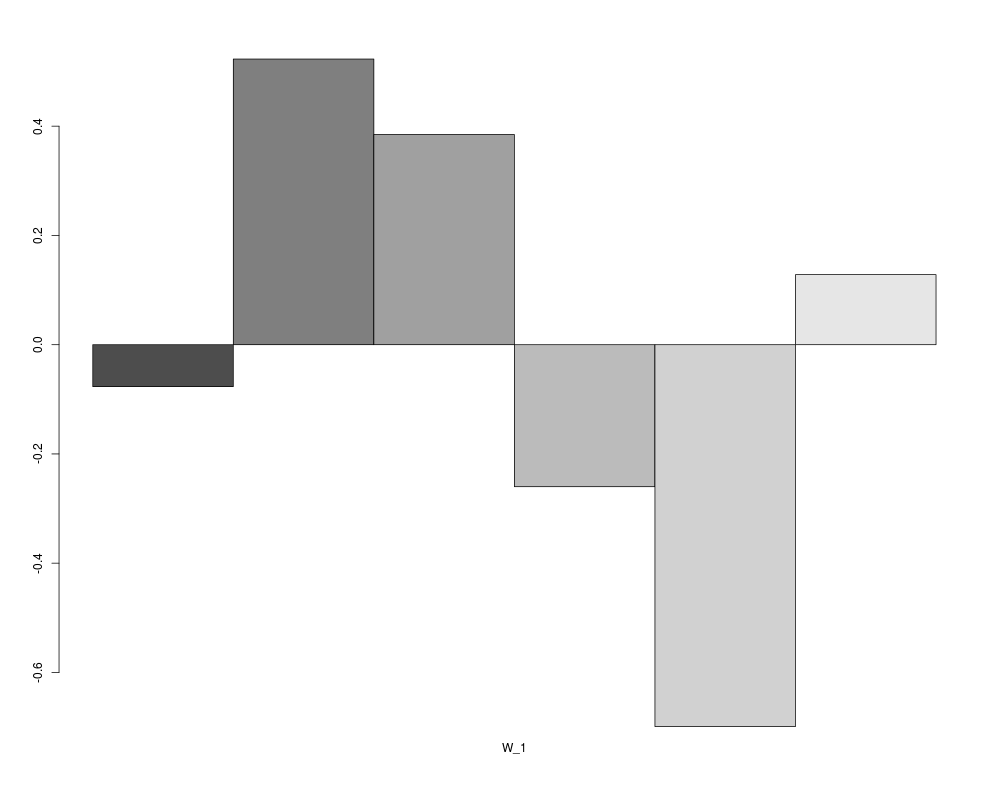
barplot(as.matrix(pData(seqRUVg)), beside=TRUE)
Results
R version 3.3.1 (2016-06-21) -- "Bug in Your Hair"
Copyright (C) 2016 The R Foundation for Statistical Computing
Platform: x86_64-pc-linux-gnu (64-bit)

R is free software and comes with ABSOLUTELY NO WARRANTY.
You are welcome to redistribute it under certain conditions.
Type 'license()' or 'licence()' for distribution details.

R is a collaborative project with many contributors.
Type 'contributors()' for more information and
'citation()' on how to cite R or R packages in publications.

Type 'demo()' for some demos, 'help()' for on-line help, or
'help.start()' for an HTML browser interface to help.
Type 'q()' to quit R.

> library(RUVSeq)
Loading required package: Biobase
Loading required package: BiocGenerics
Loading required package: parallel

Attaching package: 'BiocGenerics'

The following objects are masked from 'package:parallel':

    clusterApply, clusterApplyLB, clusterCall, clusterEvalQ,
    clusterExport, clusterMap, parApply, parCapply, parLapply,
    parLapplyLB, parRapply, parSapply, parSapplyLB

The following objects are masked from 'package:stats':

    IQR, mad, xtabs

The following objects are masked from 'package:base':

    Filter, Find, Map, Position, Reduce, anyDuplicated, append,
    as.data.frame, cbind, colnames, do.call, duplicated, eval, evalq,
    get, grep, grepl, intersect, is.unsorted, lapply, lengths, mapply,
    match, mget, order, paste, pmax, pmax.int, pmin, pmin.int, rank,
    rbind, rownames, sapply, setdiff, sort, table, tapply, union,
    unique, unsplit

Welcome to Bioconductor

    Vignettes contain introductory material; view with
    'browseVignettes()'. To cite Bioconductor, see
    'citation("Biobase")', and for packages 'citation("pkgname")'.

Loading required package: EDASeq
Loading required package: ShortRead
Loading required package: BiocParallel
Loading required package: Biostrings
Loading required package: S4Vectors
Loading required package: stats4

Attaching package: 'S4Vectors'

The following objects are masked from 'package:base':

    colMeans, colSums, expand.grid, rowMeans, rowSums

Loading required package: IRanges
Loading required package: XVector
Loading required package: Rsamtools
Loading required package: GenomeInfoDb
Loading required package: GenomicRanges
Loading required package: GenomicAlignments
Loading required package: SummarizedExperiment
Loading required package: edgeR
Loading required package: limma

Attaching package: 'limma'

The following object is masked from 'package:BiocGenerics':

    plotMA

> png(filename="/home/ddbj/snapshot/RGM3/R_BC/result/RUVSeq/RUVg.Rd_%03d_medium.png", width=480, height=480)
> ### Name: RUVg-methods
> ### Title: Remove Unwanted Variation Using Control Genes
> ### Aliases: RUVg RUVg-methods RUVg,matrix,ANY,numeric-method
> ###   RUVg,SeqExpressionSet,character,numeric-method
>
> ### ** Examples
>
> library(zebrafishRNASeq)
> data(zfGenes)
>
> ## run on a subset of genes for time reasons
> ## (real analyses should be performed on all genes)
> genes <- rownames(zfGenes)[grep("^ENS", rownames(zfGenes))]
> spikes <- rownames(zfGenes)[grep("^ERCC", rownames(zfGenes))]
> set.seed(123)
> idx <- c(sample(genes, 1000), spikes)
> seq <- newSeqExpressionSet(as.matrix(zfGenes[idx,]))
>
> # RUVg normalization
> seqRUVg <- RUVg(seq, spikes, k=1)
>
> pData(seqRUVg)
              W_1
Ctl1  -0.07675368
Ctl3   0.52288762
Ctl5   0.38470564
Trt9  -0.25997886
Trt11 -0.69905397
Trt13  0.12819326
> head(normCounts(seqRUVg))
                   Ctl1 Ctl3 Ctl5 Trt9 Trt11 Trt13
ENSDARG00000043686    2    3    1    0     2     0
ENSDARG00000089089    0    0    0    0     0     0
ENSDARG00000060813  278  158  214  228   202   722
ENSDARG00000092245    0    7    2    0    10     2
ENSDARG00000094339    0    0    0    0     0     0
ENSDARG00000007918  125   81   58   69    76   141
>
> plotRLE(seq, outline=FALSE, ylim=c(-3, 3))
> plotRLE(seqRUVg, outline=FALSE, ylim=c(-3, 3))
>
> barplot(as.matrix(pData(seqRUVg)), beside=TRUE)
>
>
>
>
>
> dev.off()
null device
          1
>
|