Supported by Dr. Osamu Ogasawara and  . . |
|
Last data update: 2014.03.03 |
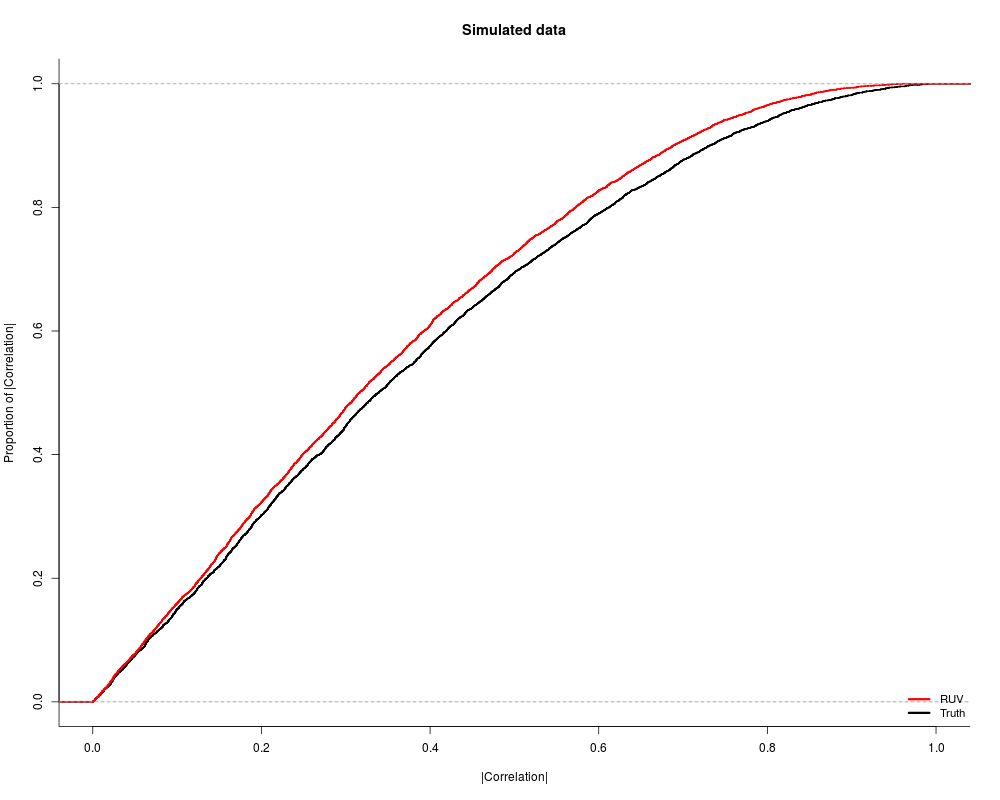
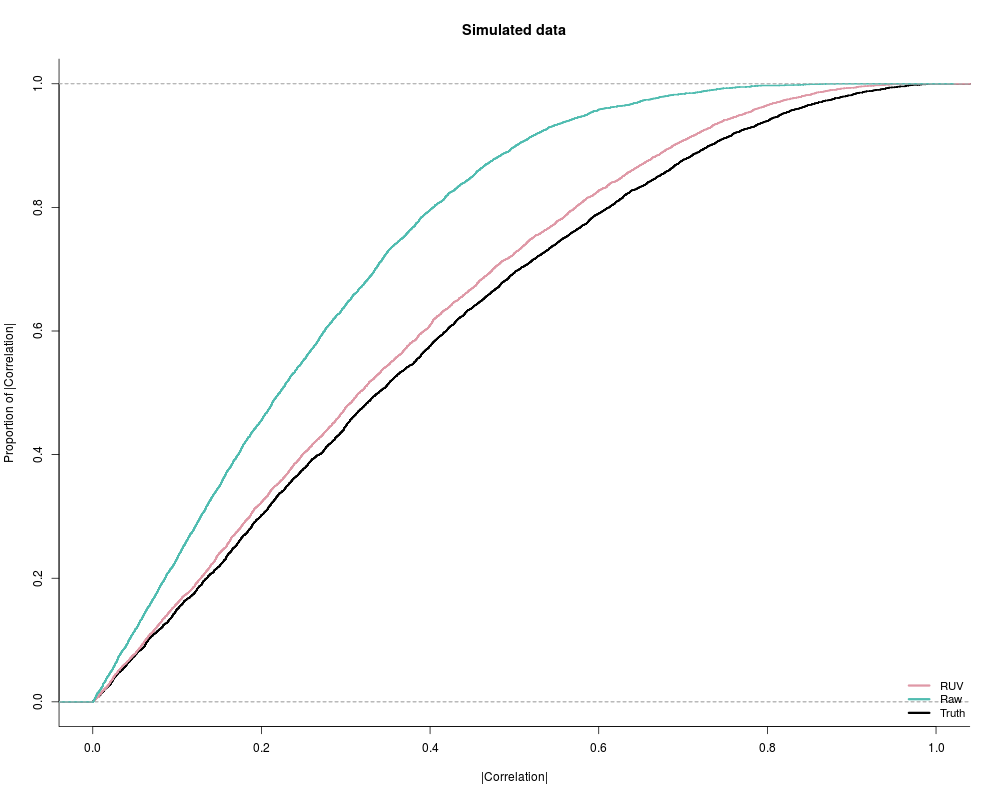
Plot empirical cumulative distribution function for correlations.Description
UsageECDFPlot(X, Y, index = "all", col.X = "red", col.Y = "black", title, legend) Arguments
Value
Author(s)Saskia Freytag Examples
Y<-simulateGEdata(500, 500, 10, 2, 5, g=NULL, Sigma.eps=0.1,
250, 100, intercept=FALSE, check.input=FALSE)
Y.hat<-RUVNaiveRidge(Y, center=TRUE, nc_index=251:500, 0, 10, check.input=TRUE)
Y.hat.cor<-cor(Y.hat)
par(mar=c(5.1, 4.1, 4.1, 2.1), mgp=c(3, 1, 0), las=0, mfrow=c(1, 1))
ECDFPlot(Y.hat.cor, Y$Sigma, index=1:100, title="Simulated data",
legend=c("RUV", "Truth"))
ECDFPlot(list(Y.hat.cor, cor(Y$Y)), Y$Sigma, index=1:100,
title="Simulated data", legend=c("RUV", "Raw", "Truth"), col.Y="black")
Results
R version 3.3.1 (2016-06-21) -- "Bug in Your Hair"
Copyright (C) 2016 The R Foundation for Statistical Computing
Platform: x86_64-pc-linux-gnu (64-bit)

R is free software and comes with ABSOLUTELY NO WARRANTY.
You are welcome to redistribute it under certain conditions.
Type 'license()' or 'licence()' for distribution details.

R is a collaborative project with many contributors.
Type 'contributors()' for more information and
'citation()' on how to cite R or R packages in publications.

Type 'demo()' for some demos, 'help()' for on-line help, or
'help.start()' for an HTML browser interface to help.
Type 'q()' to quit R.

> library(RUVcorr)
> png(filename="/home/ddbj/snapshot/RGM3/R_BC/result/RUVcorr/ECDFPlot.Rd_%03d_medium.png", width=480, height=480)
> ### Name: ECDFPlot
> ### Title: Plot empirical cumulative distribution function for
> ###   correlations.
> ### Aliases: ECDFPlot
>
> ### ** Examples
>
> Y<-simulateGEdata(500, 500, 10, 2, 5, g=NULL, Sigma.eps=0.1,
+ 250, 100, intercept=FALSE, check.input=FALSE)
> Y.hat<-RUVNaiveRidge(Y, center=TRUE, nc_index=251:500, 0, 10, check.input=TRUE)
> Y.hat.cor<-cor(Y.hat)
> par(mar=c(5.1, 4.1, 4.1, 2.1), mgp=c(3, 1, 0), las=0, mfrow=c(1, 1))
> ECDFPlot(Y.hat.cor, Y$Sigma, index=1:100, title="Simulated data",
+ legend=c("RUV", "Truth"))
> ECDFPlot(list(Y.hat.cor, cor(Y$Y)), Y$Sigma, index=1:100,
+ title="Simulated data", legend=c("RUV", "Raw", "Truth"), col.Y="black")
Warning message:
In ECDFPlot(list(Y.hat.cor, cor(Y$Y)), Y$Sigma, index = 1:100, title = "Simulated data",  :
  Specified colors are no longer valid.
>
>
>
>
>
> dev.off()
null device
          1
>
|
Created & Maintained by Osamu Ogasawara (osamu.ogasawara@gmail.com) and 