Supported by Dr. Osamu Ogasawara and  . . |
|
Last data update: 2014.03.03 |
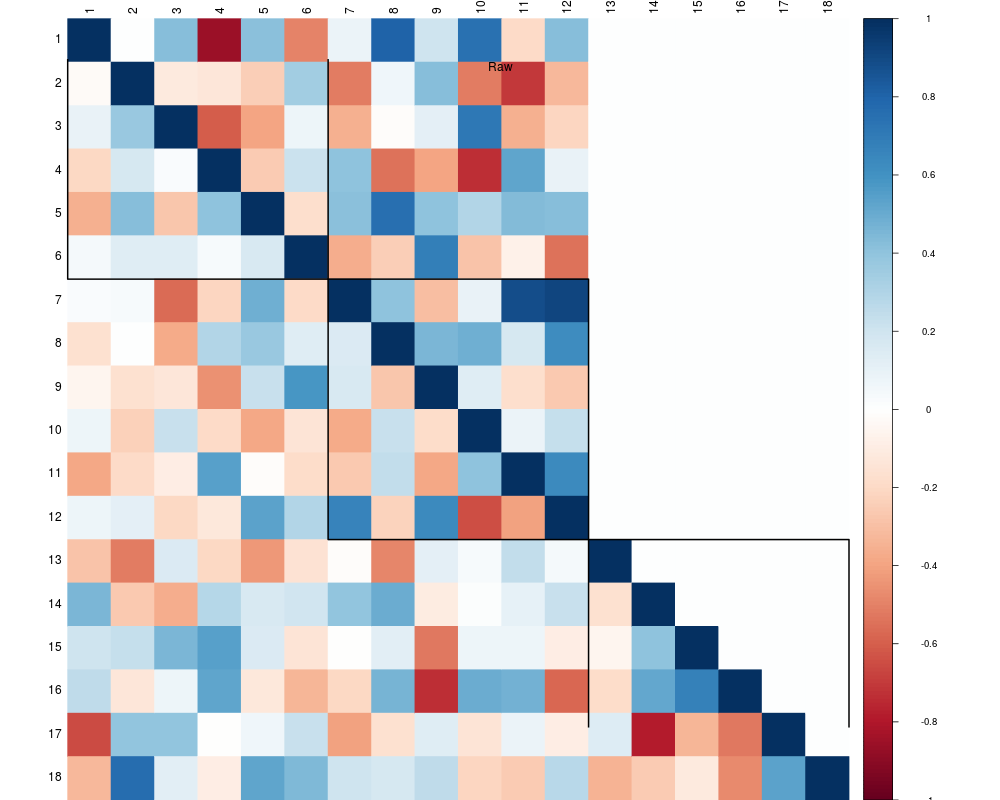
Correlation plot to compare estimated correlations with true correlations.Description
UsagecorrelationPlot(true, est, plot.genes = sample(1:dim(true)[1], 18), boxes = TRUE, title, line = -1) Arguments
DetailsThe upper triangle of the correlation plot shows the true gene-gene correlation values, while the lower triangle of the correlation plot shows the gene-gene correlation values calculated from the estimated gene expression values. This is possible because correlation matrices are symmetric. Value
Author(s)Saskia Freytag See Also
ExamplesY<-simulateGEdata(500, 500, 10, 2, 5, g=NULL, Sigma.eps=0.1, 250, 100, intercept=FALSE, check.input=FALSE) correlationPlot(Y$Sigma, Y$Y, title="Raw", plot.genes=c(sample(1:100, 6), sample(101:250, 6), sample(251:500, 6))) Results
R version 3.3.1 (2016-06-21) -- "Bug in Your Hair"
Copyright (C) 2016 The R Foundation for Statistical Computing
Platform: x86_64-pc-linux-gnu (64-bit)

R is free software and comes with ABSOLUTELY NO WARRANTY.
You are welcome to redistribute it under certain conditions.
Type 'license()' or 'licence()' for distribution details.

R is a collaborative project with many contributors.
Type 'contributors()' for more information and
'citation()' on how to cite R or R packages in publications.

Type 'demo()' for some demos, 'help()' for on-line help, or
'help.start()' for an HTML browser interface to help.
Type 'q()' to quit R.

> library(RUVcorr)
> png(filename="/home/ddbj/snapshot/RGM3/R_BC/result/RUVcorr/correlationPlot.Rd_%03d_medium.png", width=480, height=480)
> ### Name: correlationPlot
> ### Title: Correlation plot to compare estimated correlations with true
> ###   correlations.
> ### Aliases: correlationPlot
>
> ### ** Examples
>
> Y<-simulateGEdata(500, 500, 10, 2, 5, g=NULL, Sigma.eps=0.1,
+ 250, 100, intercept=FALSE, check.input=FALSE)
> correlationPlot(Y$Sigma, Y$Y, title="Raw",
+ plot.genes=c(sample(1:100, 6), sample(101:250, 6), sample(251:500, 6)))
>
>
>
>
>
> dev.off()
null device
          1
>
|