R: Remove unwanted variation from a gene expression matrix using...
naiveReplicateRUV
R Documentation
Remove unwanted variation from a gene expression matrix using replicate samples
Description
The function takes as input a gene expression matrix
as well as the index of negative control genes and replicate
samples. It estimates and remove unwanted variation from the gene
expression.
Expression matrix where the rows are the samples and the columns are the genes.
cIdx
Column index of the negative control genes in Y, for estimation of unwanted variation.
scIdx
Matrix giving the set of replicates. Each row is a
set of arrays corresponding to replicates of the same sample. The
number of columns is the size of the largest set of replicates, and
the smaller sets are padded with -1 values. For example if the sets
of replicates are (1,11,21), (2,3), (4,5), (6,7,8), the scIdx should
be
1 11 21
2 3 -1
4 5 -1
6 7 8
k
Desired rank for the estimated unwanted variation
term. The returned rank may be lower if the replicate arrays and
control genes did not contain a signal of rank k.
rrem
Optional, indicates which arrays should be removed
from the returned result. Useful if the replicate arrays were not
actual samples but mixtures of RNA which are only useful to
estimate UV but which should not be included in the analysis.
p
Optional. If given, the function returns an estimate of the term of interest
using rank-p restriction of the SVD of the corrected matrix.
tol
Directions of variance lower than this value in the
replicate samples are dropped (which may result in an estimated
unwanted variation term of rank smaller than k).
Details
In terms of model, the rank k can be thought of as the
number of independent sources of unwanted variation in the data (i.e.,
if one source is a linear combination of other sources, it does not
increase the rank).
In practice, even if the real number of independent sources of unwanted
variation is known, using a smaller k (resp.,
larger ridge) could yield better corrections because one may not have
enough samples to effectively estimate all the effects.
Value
A list containing the following terms:
X, b
if p is not NULL, contains an estimate of the factor
of interest (X) and its effect (beta) obtained using rank-p
restriction of the SVD of Y - W alpha.
W, a
Estimates of the unwanted variation factors (W) and their effect (alpha).
cY
The corrected expression matrix Y - W alpha
Yctls
The differences of replicate arrays which were used to
estimate W and alpha.
Examples
if(require('RUVnormalizeData')){
## Load the data
data('gender', package='RUVnormalizeData')
Y <- t(exprs(gender))
X <- as.numeric(phenoData(gender)$gender == 'M')
X <- X - mean(X)
X <- cbind(X/(sqrt(sum(X^2))))
chip <- annotation(gender)
## Extract regions and labs for plotting purposes
lregions <- sapply(rownames(Y),FUN=function(s) strsplit(s,'_')[[1]][2])
llabs <- sapply(rownames(Y),FUN=function(s) strsplit(s,'_')[[1]][3])
## Dimension of the factors
m <- nrow(Y)
n <- ncol(Y)
p <- ncol(X)
Y <- scale(Y, scale=FALSE) # Center gene expressions
cIdx <- which(featureData(gender)$isNegativeControl) # Negative control genes
## Prepare plots
annot <- cbind(as.character(sign(X)))
colnames(annot) <- 'gender'
plAnnots <- list('gender'='categorical')
lab.and.region <- apply(rbind(lregions, llabs),2,FUN=function(v) paste(v,collapse='_'))
gender.col <- c('-1' = "deeppink3", '1' = "blue")
## Remove platform effect by centering.
Y[chip=='hgu95a.db',] <- scale(Y[chip=='hgu95a.db',], scale=FALSE)
Y[chip=='hgu95av2.db',] <- scale(Y[chip=='hgu95av2.db',], scale=FALSE)
## Prepare control samples
scIdx <- matrix(-1,84,3)
rny <- rownames(Y)
added <- c()
c <- 0
## Replicates by lab
for(r in 1:(length(rny) - 1)){
if(r %in% added)
next
c <- c+1
scIdx[c,1] <- r
cc <- 2
for(rr in seq(along=rny[(r+1):length(rny)])){
if(all(strsplit(rny[r],'_')[[1]][-3] == strsplit(rny[r+rr],'_')[[1]][-3])){
scIdx[c,cc] <- r+rr
cc <- cc+1
added <- c(added,r+rr)
}
}
}
scIdxLab <- scIdx
scIdx <- matrix(-1,84,3)
rny <- rownames(Y)
added <- c()
c <- 0
## Replicates by region
for(r in 1:(length(rny) - 1)){
if(r %in% added)
next
c <- c+1
scIdx[c,1] <- r
cc <- 2
for(rr in seq(along=rny[(r+1):length(rny)])){
if(all(strsplit(rny[r],'_')[[1]][-2] == strsplit(rny[r+rr],'_')[[1]][-2])){
scIdx[c,cc] <- r+rr
cc <- cc+1
added <- c(added,r+rr)
}
}
}
scIdx <- rbind(scIdxLab,scIdx)
## Number of genes kept for clustering, based on their variance
nKeep <- 1260
## Prepare plots
annot <- cbind(as.character(sign(X)))
colnames(annot) <- 'gender'
plAnnots <- list('gender'='categorical')
lab.and.region <- apply(rbind(lregions, llabs),2,FUN=function(v) paste(v,collapse='_'))
gender.col <- c('-1' = "deeppink3", '1' = "blue")
## Remove platform effect by centering.
## Correction
sRes <- naiveReplicateRUV(Y, cIdx, scIdx, k=20)
## Clustering on the corrected data
sdY <- apply(sRes$cY, 2, sd)
ssd <- sort(sdY,decreasing=TRUE,index.return=TRUE)$ix
kmresRep <- kmeans(sRes$cY[,ssd[1:nKeep],drop=FALSE],centers=2,nstart=200)
vclustRep <- kmresRep$cluster
RepScore <- clScore(vclustRep,X)
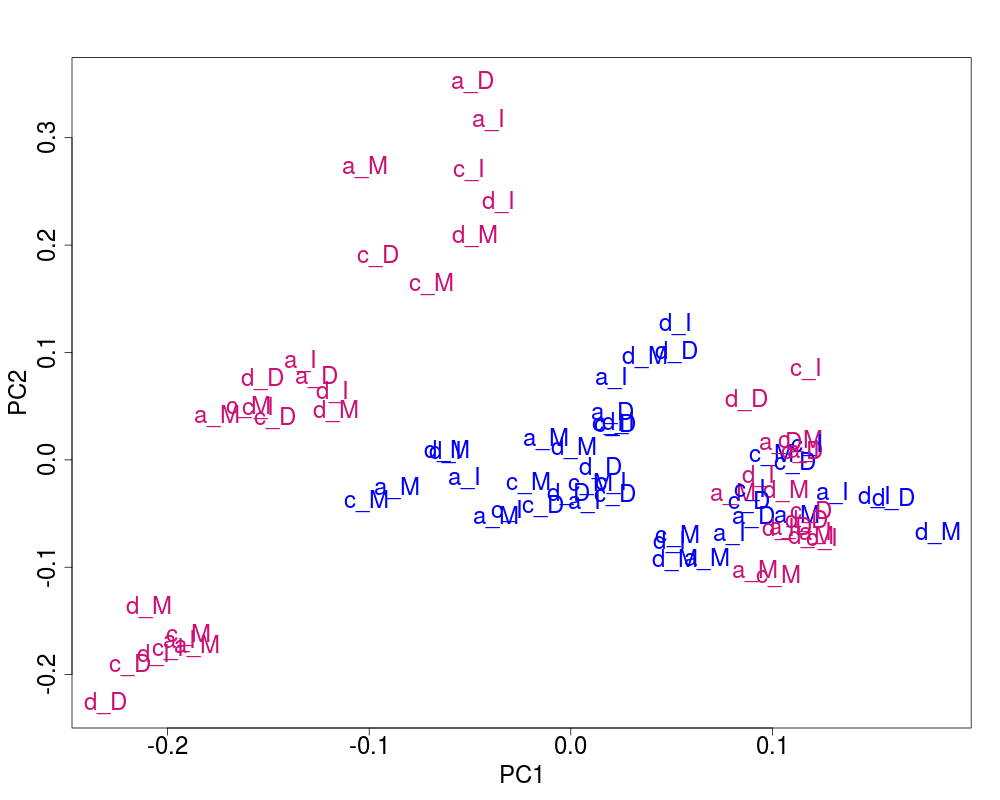
## Plot of the corrected data
svdResRep <- NULL
svdResRep <- svdPlot(sRes$cY[, ssd[1:nKeep], drop=FALSE],
annot=annot,
labels=lab.and.region,
svdRes=svdResRep,
plAnnots=plAnnots,
kColors=gender.col, file=NULL)
}
Results
R version 3.3.1 (2016-06-21) -- "Bug in Your Hair"
Copyright (C) 2016 The R Foundation for Statistical Computing
Platform: x86_64-pc-linux-gnu (64-bit)

R is free software and comes with ABSOLUTELY NO WARRANTY.
You are welcome to redistribute it under certain conditions.
Type 'license()' or 'licence()' for distribution details.

R is a collaborative project with many contributors.
Type 'contributors()' for more information and
'citation()' on how to cite R or R packages in publications.

Type 'demo()' for some demos, 'help()' for on-line help, or
'help.start()' for an HTML browser interface to help.
Type 'q()' to quit R.

> library(RUVnormalize)
> png(filename="/home/ddbj/snapshot/RGM3/R_BC/result/RUVnormalize/naiveReplicateRUV.Rd_%03d_medium.png", width=480, height=480)
> ### Name: naiveReplicateRUV
> ### Title: Remove unwanted variation from a gene expression matrix using
> ###   replicate samples
> ### Aliases: naiveReplicateRUV
>
> ### ** Examples
>
>     if(require('RUVnormalizeData')){
+
+          ## Load the data
+          data('gender', package='RUVnormalizeData')
+
+          Y <- t(exprs(gender))
+          X <- as.numeric(phenoData(gender)$gender == 'M')
+          X <- X - mean(X)
+          X <- cbind(X/(sqrt(sum(X^2))))
+          chip <- annotation(gender)
+
+          ## Extract regions and labs for plotting purposes
+          lregions <- sapply(rownames(Y),FUN=function(s) strsplit(s,'_')[[1]][2])
+          llabs <- sapply(rownames(Y),FUN=function(s) strsplit(s,'_')[[1]][3])
+
+          ## Dimension of the factors
+          m <- nrow(Y)
+          n <- ncol(Y)
+          p <- ncol(X)
+
+          Y <- scale(Y, scale=FALSE) # Center gene expressions
+
+          cIdx <- which(featureData(gender)$isNegativeControl) # Negative control genes
+
+          ## Prepare plots
+          annot <- cbind(as.character(sign(X)))
+          colnames(annot) <- 'gender'
+          plAnnots <- list('gender'='categorical')
+          lab.and.region <- apply(rbind(lregions, llabs),2,FUN=function(v) paste(v,collapse='_'))
+          gender.col <- c('-1' = "deeppink3", '1' = "blue")
+
+          ## Remove platform effect by centering.
+
+          Y[chip=='hgu95a.db',] <- scale(Y[chip=='hgu95a.db',], scale=FALSE)
+          Y[chip=='hgu95av2.db',] <- scale(Y[chip=='hgu95av2.db',], scale=FALSE)
+
+          ## Prepare control samples
+
+          scIdx <- matrix(-1,84,3)
+          rny <- rownames(Y)
+          added <- c()
+          c <- 0
+
+          ## Replicates by lab
+          for(r in 1:(length(rny) - 1)){
+              if(r %in% added)
+                  next
+              c <- c+1
+              scIdx[c,1] <- r
+              cc <- 2
+              for(rr in seq(along=rny[(r+1):length(rny)])){
+                  if(all(strsplit(rny[r],'_')[[1]][-3] ==  strsplit(rny[r+rr],'_')[[1]][-3])){
+                      scIdx[c,cc] <- r+rr
+                      cc <- cc+1
+                      added <- c(added,r+rr)
+                  }
+              }
+         }
+        scIdxLab <- scIdx
+
+          scIdx <- matrix(-1,84,3)
+          rny <- rownames(Y)
+          added <- c()
+          c <- 0
+
+          ## Replicates by region
+          for(r in 1:(length(rny) - 1)){
+              if(r %in% added)
+                  next
+              c <- c+1
+              scIdx[c,1] <- r
+              cc <- 2
+              for(rr in seq(along=rny[(r+1):length(rny)])){
+                  if(all(strsplit(rny[r],'_')[[1]][-2] ==  strsplit(rny[r+rr],'_')[[1]][-2])){
+                      scIdx[c,cc] <- r+rr
+                      cc <- cc+1
+                      added <- c(added,r+rr)
+                  }
+              }
+          }
+          scIdx <- rbind(scIdxLab,scIdx)
+
+          ## Number of genes kept for clustering, based on their variance
+          nKeep <- 1260
+
+          ## Prepare plots
+          annot <- cbind(as.character(sign(X)))
+          colnames(annot) <- 'gender'
+          plAnnots <- list('gender'='categorical')
+          lab.and.region <- apply(rbind(lregions, llabs),2,FUN=function(v) paste(v,collapse='_'))
+          gender.col <- c('-1' = "deeppink3", '1' = "blue")
+
+          ## Remove platform effect by centering.
+
+          ## Correction
+          sRes <- naiveReplicateRUV(Y, cIdx, scIdx, k=20)
+
+          ## Clustering on the corrected data
+          sdY <- apply(sRes$cY, 2, sd)
+          ssd <- sort(sdY,decreasing=TRUE,index.return=TRUE)$ix
+          kmresRep <- kmeans(sRes$cY[,ssd[1:nKeep],drop=FALSE],centers=2,nstart=200)
+          vclustRep <- kmresRep$cluster
+          RepScore <- clScore(vclustRep,X)
+
+          ## Plot of the corrected data
+          svdResRep <- NULL
+          svdResRep <- svdPlot(sRes$cY[, ssd[1:nKeep], drop=FALSE],
+                               annot=annot,
+                               labels=lab.and.region,
+                               svdRes=svdResRep,
+                               plAnnots=plAnnots,
+                               kColors=gender.col, file=NULL)
+      }
Loading required package: RUVnormalizeData
Loading required package: Biobase
Loading required package: BiocGenerics
Loading required package: parallel

Attaching package: 'BiocGenerics'

The following objects are masked from 'package:parallel':

    clusterApply, clusterApplyLB, clusterCall, clusterEvalQ,
    clusterExport, clusterMap, parApply, parCapply, parLapply,
    parLapplyLB, parRapply, parSapply, parSapplyLB

The following objects are masked from 'package:stats':

    IQR, mad, xtabs

The following objects are masked from 'package:base':

    Filter, Find, Map, Position, Reduce, anyDuplicated, append,
    as.data.frame, cbind, colnames, do.call, duplicated, eval, evalq,
    get, grep, grepl, intersect, is.unsorted, lapply, lengths, mapply,
    match, mget, order, paste, pmax, pmax.int, pmin, pmin.int, rank,
    rbind, rownames, sapply, setdiff, sort, table, tapply, union,
    unique, unsplit

Welcome to Bioconductor

    Vignettes contain introductory material; view with
    'browseVignettes()'. To cite Bioconductor, see
    'citation("Biobase")', and for packages 'citation("pkgname")'.

>
>
>
>
>
> dev.off()
null device
          1
>
 .
.