Supported by Dr. Osamu Ogasawara and  . . |
|
Last data update: 2014.03.03 |
True MSE Risk of Shrinkage Resulting from Known Regression ParametersDescriptionBy specifying numerical values for regression parameters (uncorrelated components and error sigma) that usually are unknown, these functions can calculate and display True MSE Risk statistics associated with shrinkage along a given Q-shaped path. Usage
  RXtrisk(form, data, trug, trus, Q = 0, rscale = 1, steps = 8,
                      qmax = 5, qmin = -5)
Arguments
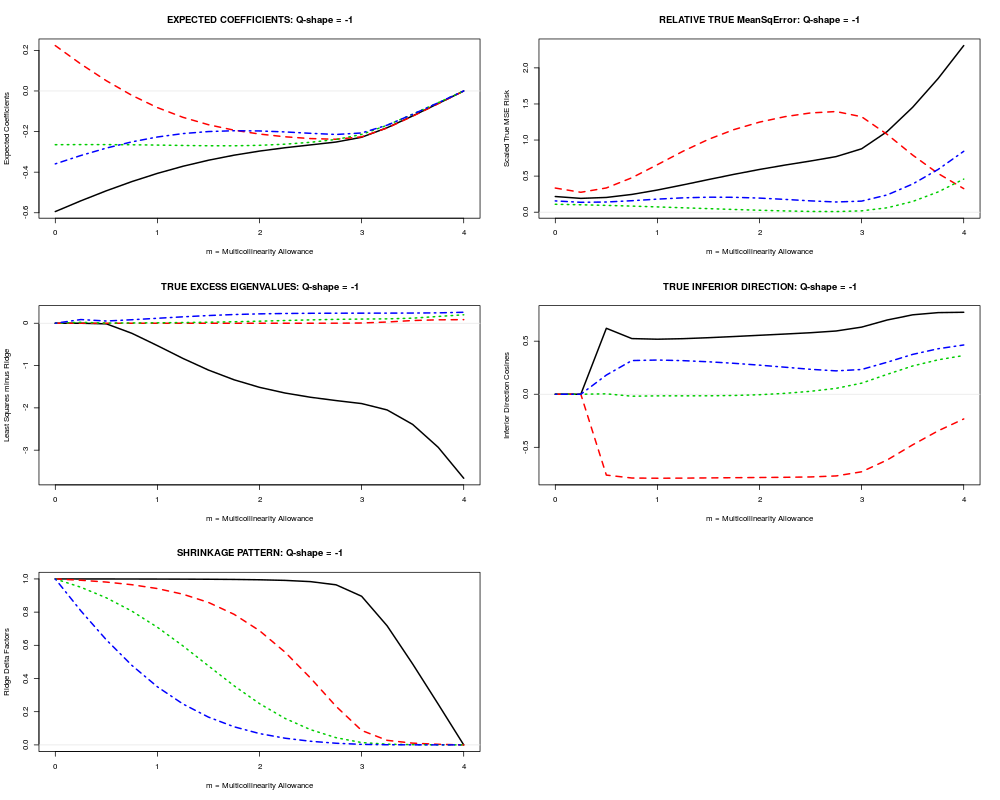
DetailsThe RXridge() functions calculate maximum likelihood estimates (corrected, if necessary, so as to have correct range) for typical statistical inference situations where regression parameters are unknowns. In sharp contrast with this usual situation, the RXtrisk() functions show exactly how expected regression coefficients and true Mean Squared Error Risk actually do change with shrinkage when regression parameters take on specified, KNOWN numerical values. ValueAn output list object of class RXtrisk:
Author(s)Bob Obenchain <wizbob@att.net> See Also
Examplesdata(mpg) form <- mpg~cylnds+cubins+hpower+weight rxrobj <- RXridge(form, data=mpg) # define true parameter values. trugam <- matrix(c(-.5,-.1,.1,-.6),4,1) trusig <- 0.4 # create true shrinkage MSE risk scenario. trumse <- RXtrisk(form, data=mpg, trugam, trusig, Q=-1, steps=4) plot(trumse) Results
R version 3.3.1 (2016-06-21) -- "Bug in Your Hair"
Copyright (C) 2016 The R Foundation for Statistical Computing
Platform: x86_64-pc-linux-gnu (64-bit)

R is free software and comes with ABSOLUTELY NO WARRANTY.
You are welcome to redistribute it under certain conditions.
Type 'license()' or 'licence()' for distribution details.

R is a collaborative project with many contributors.
Type 'contributors()' for more information and
'citation()' on how to cite R or R packages in publications.

Type 'demo()' for some demos, 'help()' for on-line help, or
'help.start()' for an HTML browser interface to help.
Type 'q()' to quit R.

> library(RXshrink)
Loading required package: lars
Loaded lars 1.2

> png(filename="/home/ddbj/snapshot/RGM3/R_CC/result/RXshrink/RXtrisk.Rd_%03d_medium.png", width=480, height=480)
> ### Name: RXtrisk
> ### Title: True MSE Risk of Shrinkage Resulting from Known Regression
> ###   Parameters
> ### Aliases: RXtrisk
> ### Keywords: regression hplot
>
> ### ** Examples
>
>   data(mpg)
>   form <- mpg~cylnds+cubins+hpower+weight
>   rxrobj <- RXridge(form, data=mpg)
>   # define true parameter values.
>   trugam <- matrix(c(-.5,-.1,.1,-.6),4,1)
>   trusig <- 0.4
>   # create true shrinkage MSE risk scenario.
>   trumse <- RXtrisk(form, data=mpg, trugam, trusig, Q=-1, steps=4)
>   plot(trumse)
>
>
>
>
>
> dev.off()
null device
          1
>
|