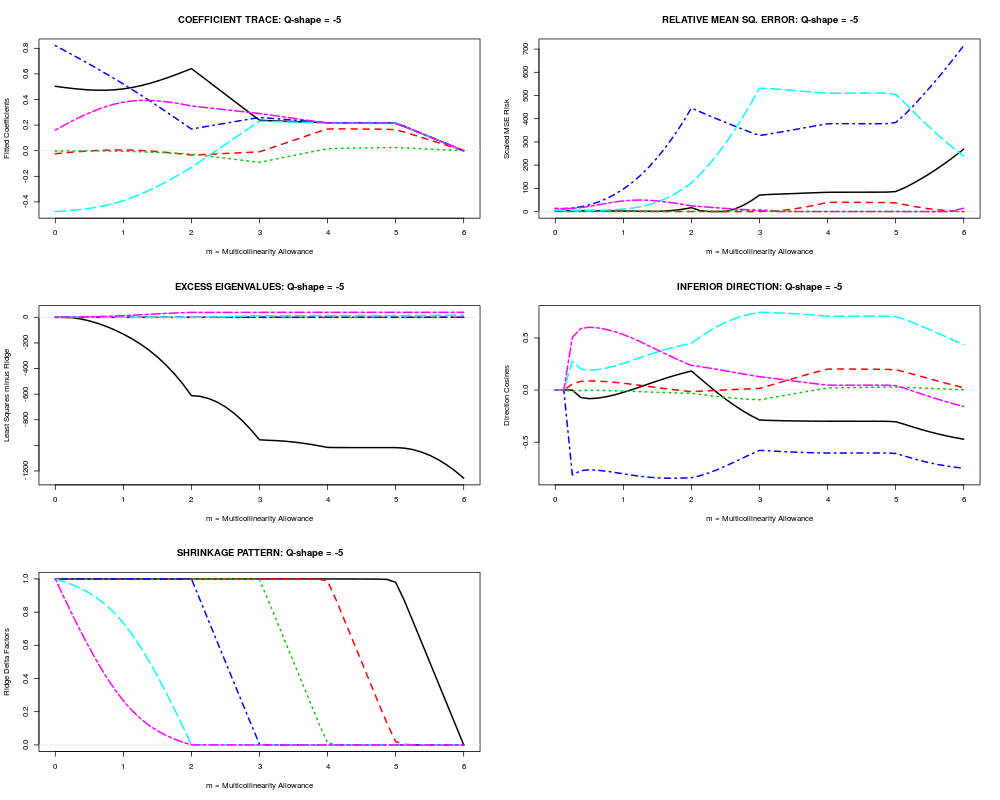
Plot trace displays for RXridge shrinkage regression coefficients. The
default is to display all five traces on one page with no legends.
Usage
  ## S3 method for class 'RXridge'
plot(x, trace = "all", trkey = FALSE, ... )
Arguments
x
Output list object of class RXridge.
trace
One of seven possible options: "all" to display 5 traces in one graph,
"seq" to display 5 full-sized traces in sequence in response to user prompts,
"coef" to display only the estimated beta coefficient trace,
"rmse" to display only the estimated relative MSE risk trace,
"exev" to display only the estimated excess MSE eigenvalue (OLS minus larlso),
"infd" to display only the estimated inferior direction cosine trace, or
"spat" to display only the delta-factor pattern trace.
trkey
If TRUE, display a crude legend at the bottom of each trace plot.
...
Optional argument(s) passed on to plot().
Value
NULL
Author(s)
Bob Obenchain <wizbob@att.net>
Examples
  data(longley2)
  form <- GNP~GNP.deflator+Unemployed+Armed.Forces+Population+Year+Employed
  rxrobj <- RXridge(form, data=longley2)
  plot(rxrobj)
Results
R version 3.3.1 (2016-06-21) -- "Bug in Your Hair"
Copyright (C) 2016 The R Foundation for Statistical Computing
Platform: x86_64-pc-linux-gnu (64-bit)

R is free software and comes with ABSOLUTELY NO WARRANTY.
You are welcome to redistribute it under certain conditions.
Type 'license()' or 'licence()' for distribution details.

R is a collaborative project with many contributors.
Type 'contributors()' for more information and
'citation()' on how to cite R or R packages in publications.

Type 'demo()' for some demos, 'help()' for on-line help, or
'help.start()' for an HTML browser interface to help.
Type 'q()' to quit R.

> library(RXshrink)
Loading required package: lars
Loaded lars 1.2

> png(filename="/home/ddbj/snapshot/RGM3/R_CC/result/RXshrink/plot.RXridge.Rd_%03d_medium.png", width=480, height=480)
> ### Name: plot.RXridge
> ### Title: Plot method for RXridge objects
> ### Aliases: plot.RXridge
> ### Keywords: hplot methods
>
> ### ** Examples
>
>   data(longley2)
>   form <- GNP~GNP.deflator+Unemployed+Armed.Forces+Population+Year+Employed
>   rxrobj <- RXridge(form, data=longley2)
>   plot(rxrobj)
>
>
>
>
>
> dev.off()
null device
          1
>
 .
.