Supported by Dr. Osamu Ogasawara and  . . |
|
Last data update: 2014.03.03 |
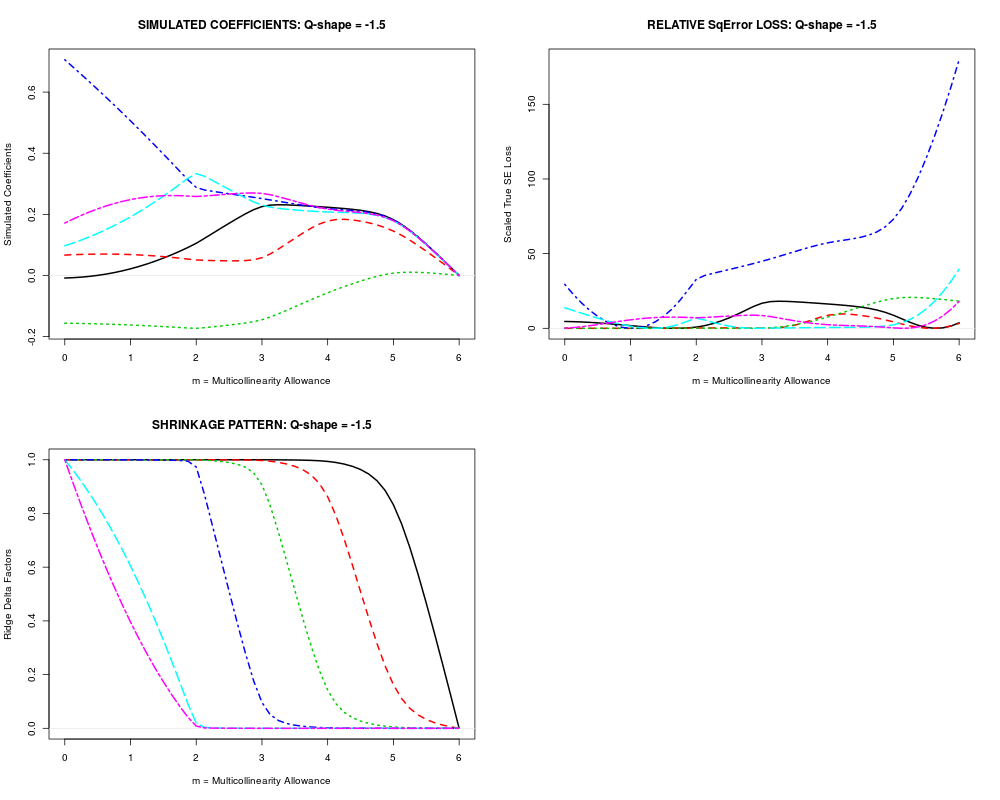
Plot method for RXtsimu objectsDescriptionPlot trace displays for RXtsimu simulated regression coefficients. The default is to display all three traces on one page with no legends. Usage## S3 method for class 'RXtsimu' plot(x, trace = "all", trkey = FALSE, ... ) Arguments
ValueNULL Author(s)Bob Obenchain <wizbob@att.net> Examplesdata(longley2) form <- GNP~GNP.deflator+Unemployed+Armed.Forces+Population+Year+Employed # set true regression parameter values not unlike their OLS estimates from RXridge(). trugam <- matrix(c(.5,-.1,.2,.2,.2,-.2),6,1) trusig <- 0.04 rxsobj <- RXtsimu(form, data=longley2, trugam, trusig, Q=-1.5) plot(rxsobj) Results
R version 3.3.1 (2016-06-21) -- "Bug in Your Hair"
Copyright (C) 2016 The R Foundation for Statistical Computing
Platform: x86_64-pc-linux-gnu (64-bit)

R is free software and comes with ABSOLUTELY NO WARRANTY.
You are welcome to redistribute it under certain conditions.
Type 'license()' or 'licence()' for distribution details.

R is a collaborative project with many contributors.
Type 'contributors()' for more information and
'citation()' on how to cite R or R packages in publications.

Type 'demo()' for some demos, 'help()' for on-line help, or
'help.start()' for an HTML browser interface to help.
Type 'q()' to quit R.

> library(RXshrink)
Loading required package: lars
Loaded lars 1.2

> png(filename="/home/ddbj/snapshot/RGM3/R_CC/result/RXshrink/plot.RXtsimu.Rd_%03d_medium.png", width=480, height=480)
> ### Name: plot.RXtsimu
> ### Title: Plot method for RXtsimu objects
> ### Aliases: plot.RXtsimu
> ### Keywords: hplot methods
>
> ### ** Examples
>
>   data(longley2)
>   form <- GNP~GNP.deflator+Unemployed+Armed.Forces+Population+Year+Employed
>   # set true regression parameter values not unlike their OLS estimates from RXridge().
>   trugam <- matrix(c(.5,-.1,.2,.2,.2,-.2),6,1)
>   trusig <- 0.04
>   rxsobj <- RXtsimu(form, data=longley2, trugam, trusig, Q=-1.5)
>   plot(rxsobj)
>
>
>
>
>
> dev.off()
null device
          1
>
|
Created & Maintained by Osamu Ogasawara (osamu.ogasawara@gmail.com) and 