Supported by Dr. Osamu Ogasawara and  . . |
|
Last data update: 2014.03.03 |
Graphical Display of The expression levelsDescriptionPlot the expression values and print statistical results for each individual gene based on a user query Usage
     plotGene(gene.to.plot,x,gene.names=NULL, data, cl,origin,
              logged=TRUE,logbase=2)
Arguments
ValueA graphical display of the expression levels of the input gene. The estimated statistics for differential expression will be printed on the plot as well as output in the screen.The statistics include: F.C.:fold-change under each dataset if multiple datasets are used AveFC: average fold-change across all datasets pfp(pval): estimated percentage of false prediction (p-value) for differential expression under each of the two tests: up-regulation in class 2 compared with classs 1 and down-regulation in class 2 compared with class 1 Author(s)Fangxin Hong fhong@salk.edu See Also
Examples
# Load the data of Golub et al. (1999). data(golub)
#contains a 3051x38 gene expression
# matrix called golub, a vector of length called golub.cl
#that consists of the 38 class labels,
# and a matrix called golub.gnames whose third column contains the gene names.
data(golub)
#use a subset of data as example, apply the rank product method
subset <- c(1:4,28:30)
#Setting rand=123, to make the results reproducible,
#identify genes that are up-regulated in class 2
#(class label =1)
RP.out <- RP(golub[,subset],golub.cl[subset], rand=123)
#plot the results
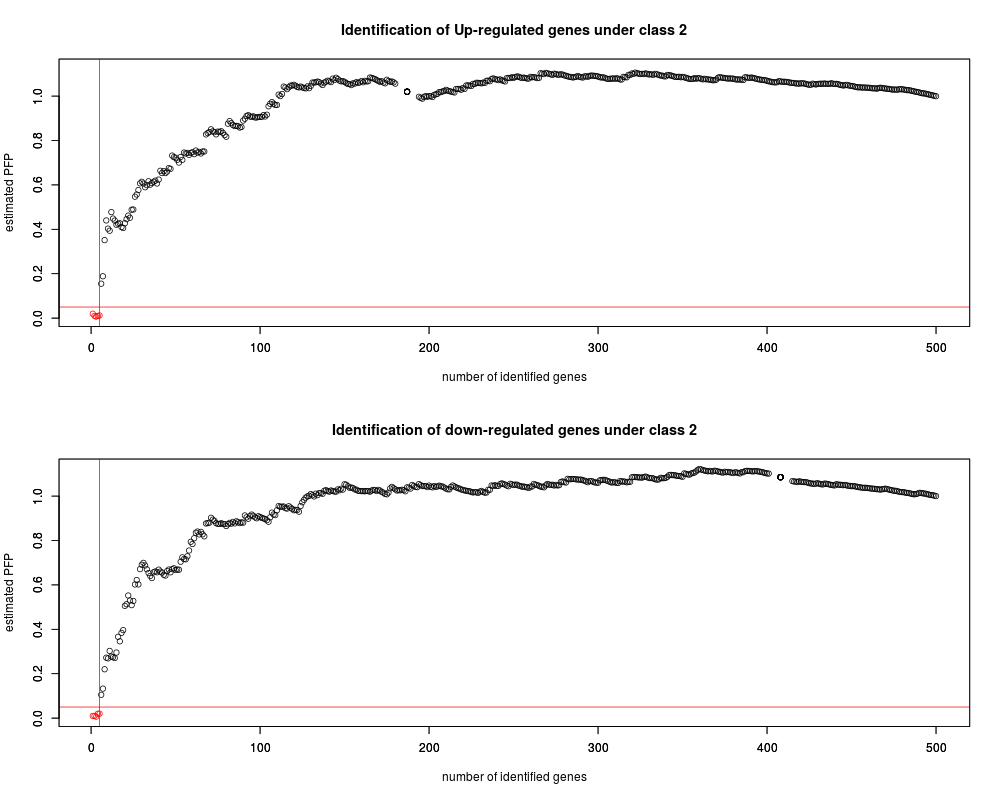
plotRP(RP.out,cutoff=0.05)
Results
R version 3.3.1 (2016-06-21) -- "Bug in Your Hair"
Copyright (C) 2016 The R Foundation for Statistical Computing
Platform: x86_64-pc-linux-gnu (64-bit)

R is free software and comes with ABSOLUTELY NO WARRANTY.
You are welcome to redistribute it under certain conditions.
Type 'license()' or 'licence()' for distribution details.

R is a collaborative project with many contributors.
Type 'contributors()' for more information and
'citation()' on how to cite R or R packages in publications.

Type 'demo()' for some demos, 'help()' for on-line help, or
'help.start()' for an HTML browser interface to help.
Type 'q()' to quit R.

> library(RankProd)
> png(filename="/home/ddbj/snapshot/RGM3/R_BC/result/RankProd/plotGene.Rd_%03d_medium.png", width=480, height=480)
> ### Name: plotGene
> ### Title: Graphical Display of The expression levels
> ### Aliases: plotGene
> ### Keywords: htest
>
> ### ** Examples
>
>
>       # Load the data of Golub et al. (1999). data(golub)
>       #contains a 3051x38 gene expression
>       # matrix called golub, a vector of length called golub.cl
>       #that consists of the 38 class labels,
>       # and a matrix called golub.gnames whose third column contains the gene names.
>       data(golub)
>
>       #use a subset of data as example, apply the rank product method
>       subset <- c(1:4,28:30)
>       #Setting rand=123, to make the results reproducible,
>
>       #identify genes that are up-regulated in class 2
>       #(class label =1)
>       RP.out <- RP(golub[,subset],golub.cl[subset], rand=123)
Rank Product analysis for two-class case

Starting 100 permutations...
Computing pfp ..
Outputing the results ..
>
>       #plot the results
>       plotRP(RP.out,cutoff=0.05)
>
>
>
>
>
>
> dev.off()
null device
          1
>
|