Supported by Dr. Osamu Ogasawara and  . . |
|
Last data update: 2014.03.03 |
Graphical Display of the Rank Product/Sum analysisDescriptionPlot a graphical display of the estimated pfp vs number of identified genes Usage
plotRP(x, cutoff=NULL)
Arguments
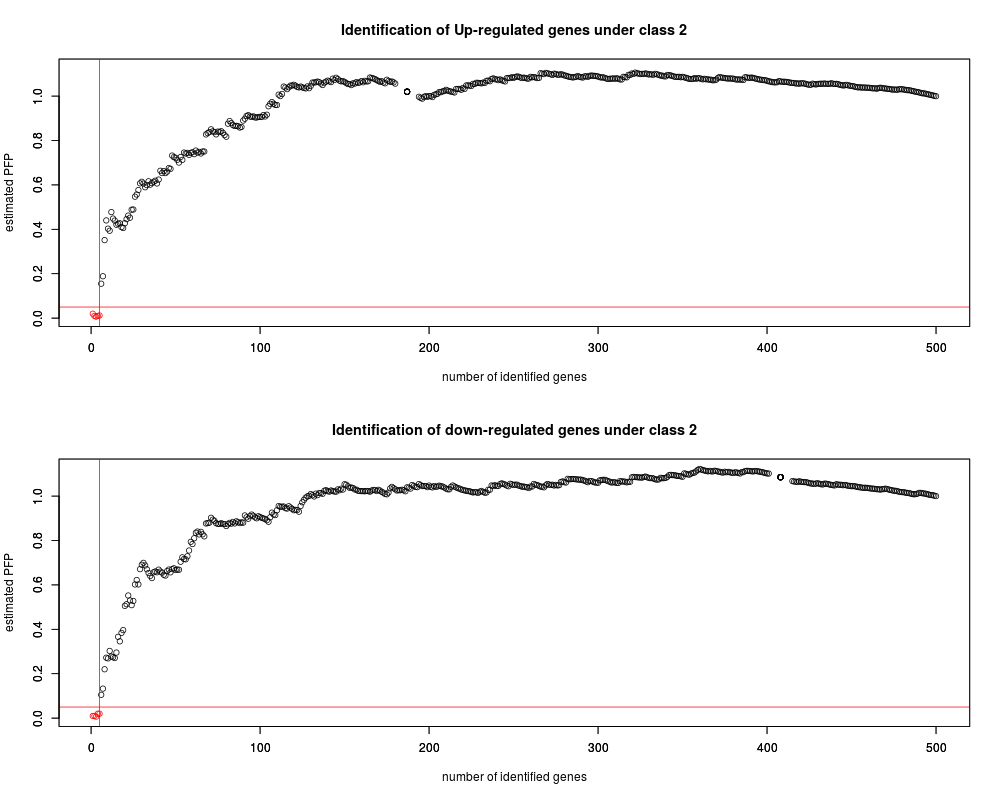
ValueA graphical display of the estimated pfp vs number of identified genes, which is also the gene rank of its original rank product/sum across all comparison. If cutoff is sepcified, a horizontal line will be plotted on the graphic to indicate the positon of the cutoff point, and all genes identified will be marked red. Two plots will be displayed, one for the identification of up-regulated genes in class 2, one for the identification of down-regulated genes in class 2 Author(s)Fangxin Hong fhong@salk.edu See Also
Examples
      # Load the data of Golub et al. (1999). data(golub)
      #contains a 3051x38 gene expression
      # matrix called golub, a vector of length called golub.cl
      #that consists of the 38 class labels,
      # and a matrix called golub.gnames whose third column contains the gene names.
      data(golub)

      #use a subset of data as example, apply the rank product method
      subset <- c(1:4,28:30)
      #Setting rand=123, to make the results reproducible,

      #identify genes that are up-regulated in class 2
      #(class label =1)
      RP.out <- RP(golub[,subset],golub.cl[subset], rand=123)

      #plot the results
      plotRP(RP.out,cutoff=0.05)
Results
R version 3.3.1 (2016-06-21) -- "Bug in Your Hair"
Copyright (C) 2016 The R Foundation for Statistical Computing
Platform: x86_64-pc-linux-gnu (64-bit)

R is free software and comes with ABSOLUTELY NO WARRANTY.
You are welcome to redistribute it under certain conditions.
Type 'license()' or 'licence()' for distribution details.

R is a collaborative project with many contributors.
Type 'contributors()' for more information and
'citation()' on how to cite R or R packages in publications.

Type 'demo()' for some demos, 'help()' for on-line help, or
'help.start()' for an HTML browser interface to help.
Type 'q()' to quit R.

> library(RankProd)
> png(filename="/home/ddbj/snapshot/RGM3/R_BC/result/RankProd/plotRP.Rd_%03d_medium.png", width=480, height=480)
> ### Name: plotRP
> ### Title: Graphical Display of the Rank Product/Sum analysis
> ### Aliases: plotRP
> ### Keywords: htest
>
> ### ** Examples
>
>
>       # Load the data of Golub et al. (1999). data(golub)
>       #contains a 3051x38 gene expression
>       # matrix called golub, a vector of length called golub.cl
>       #that consists of the 38 class labels,
>       # and a matrix called golub.gnames whose third column contains the gene names.
>       data(golub)
>
>       #use a subset of data as example, apply the rank product method
>       subset <- c(1:4,28:30)
>       #Setting rand=123, to make the results reproducible,
>
>       #identify genes that are up-regulated in class 2
>       #(class label =1)
>       RP.out <- RP(golub[,subset],golub.cl[subset], rand=123)
Rank Product analysis for two-class case

Starting 100 permutations...
Computing pfp ..
Outputing the results ..
>
>       #plot the results
>       plotRP(RP.out,cutoff=0.05)
>
>
>
>
>
>
> dev.off()
null device
          1
>
|
Created & Maintained by Osamu Ogasawara (osamu.ogasawara@gmail.com) and 