Supported by Dr. Osamu Ogasawara and  . . |
|
Last data update: 2014.03.03 |
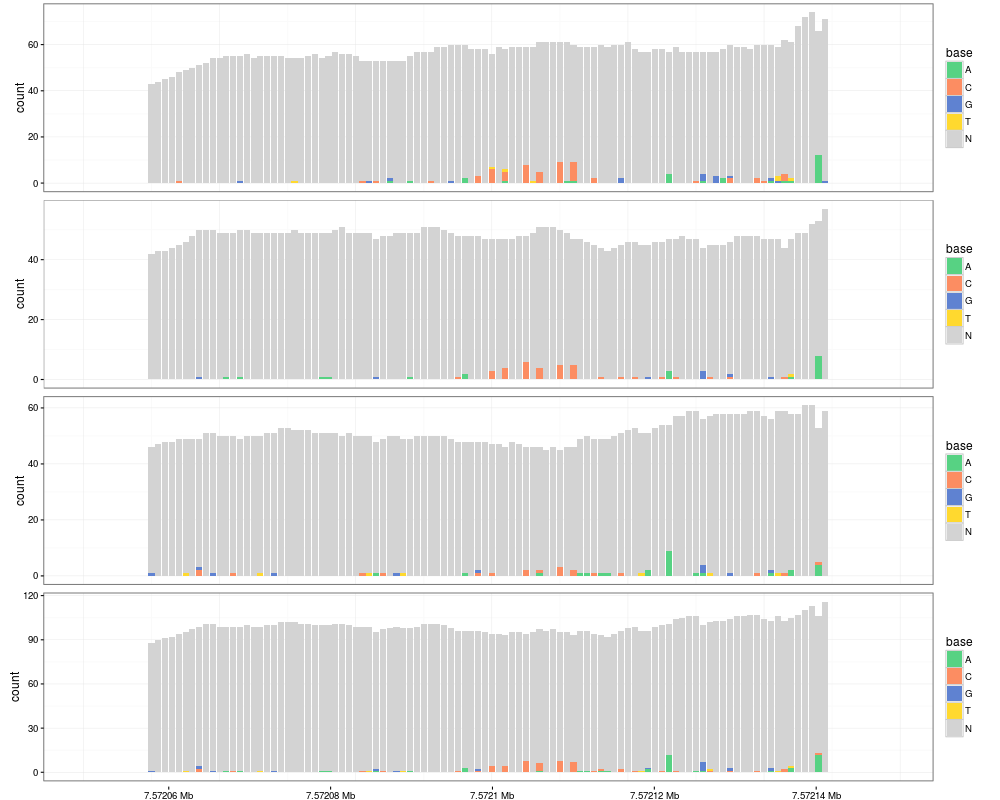
Mismatch plot from BAM filesDescriptionCreate a mismatch plot from a list of BAM files directly. UsagetallyPlot(file, region, ref, nCycles = 0, minQual = 0, minFreq = 0, ...) Arguments
ValueA 'ggplot2' or 'ggbio' object. See Alsoh5vc::mismatchPlot Examples
  library(ggbio)
  library(GenomicRanges)
  library(BSgenome.Hsapiens.UCSC.hg19)

  region = GRanges("chr17", IRanges(7572100, width = 1))

  control_bam = system.file("extdata", "platinum", "control.bam", package =
  "Rariant", mustWork = TRUE)
  mix_bam = system.file("extdata", "platinum", "mix.bam", package = "Rariant",
  mustWork = TRUE)

  bam_files = c(control_bam, mix_bam)

  region = GRanges("chr17", IRanges(7572050, width = 100))

  control_bam = system.file("extdata", "platinum", "control.bam", package =
    "Rariant", mustWork = TRUE)
  test1_bam = system.file("extdata", "platinum", "test.bam", package =
    "Rariant", mustWork = TRUE)
  test2_bam = system.file("extdata", "platinum", "test2.bam", package =
    "Rariant", mustWork = TRUE)
  mix_bam = system.file("extdata", "platinum", "mix.bam", package =
    "Rariant", mustWork = TRUE)

  bam_files = c(control_bam, test1_bam, test2_bam, mix_bam)

  library(BSgenome.Hsapiens.UCSC.hg19)
  ref = BSgenome.Hsapiens.UCSC.hg19

  p = tracks(lapply(bam_files, tallyPlot, region, ref, minQual = 25))

  print(p)
Results
R version 3.3.1 (2016-06-21) -- "Bug in Your Hair"
Copyright (C) 2016 The R Foundation for Statistical Computing
Platform: x86_64-pc-linux-gnu (64-bit)

R is free software and comes with ABSOLUTELY NO WARRANTY.
You are welcome to redistribute it under certain conditions.
Type 'license()' or 'licence()' for distribution details.

R is a collaborative project with many contributors.
Type 'contributors()' for more information and
'citation()' on how to cite R or R packages in publications.

Type 'demo()' for some demos, 'help()' for on-line help, or
'help.start()' for an HTML browser interface to help.
Type 'q()' to quit R.

> library(Rariant)
Loading required package: GenomicRanges
Loading required package: BiocGenerics
Loading required package: parallel

Attaching package: 'BiocGenerics'

The following objects are masked from 'package:parallel':

    clusterApply, clusterApplyLB, clusterCall, clusterEvalQ,
    clusterExport, clusterMap, parApply, parCapply, parLapply,
    parLapplyLB, parRapply, parSapply, parSapplyLB

The following objects are masked from 'package:stats':

    IQR, mad, xtabs

The following objects are masked from 'package:base':

    Filter, Find, Map, Position, Reduce, anyDuplicated, append,
    as.data.frame, cbind, colnames, do.call, duplicated, eval, evalq,
    get, grep, grepl, intersect, is.unsorted, lapply, lengths, mapply,
    match, mget, order, paste, pmax, pmax.int, pmin, pmin.int, rank,
    rbind, rownames, sapply, setdiff, sort, table, tapply, union,
    unique, unsplit

Loading required package: S4Vectors
Loading required package: stats4

Attaching package: 'S4Vectors'

The following objects are masked from 'package:base':

    colMeans, colSums, expand.grid, rowMeans, rowSums

Loading required package: IRanges
Loading required package: GenomeInfoDb
Loading required package: VariantAnnotation
Loading required package: SummarizedExperiment
Loading required package: Biobase
Welcome to Bioconductor

    Vignettes contain introductory material; view with
    'browseVignettes()'. To cite Bioconductor, see
    'citation("Biobase")', and for packages 'citation("pkgname")'.

Loading required package: Rsamtools
Loading required package: Biostrings
Loading required package: XVector

Attaching package: 'VariantAnnotation'

The following object is masked from 'package:base':

    tabulate

Warning message:
replacing previous import 'ggplot2::Position' by 'BiocGenerics::Position' when loading 'ggbio'
> png(filename="/home/ddbj/snapshot/RGM3/R_BC/result/Rariant/mismatch-plot.rd_%03d_medium.png", width=480, height=480)
> ### Name: tallyPlot
> ### Title: Mismatch plot from BAM files
> ### Aliases: tallyPlot
>
> ### ** Examples
>
>   library(ggbio)
Loading required package: ggplot2
Need specific help about ggbio? try mailing
 the maintainer or visit http://tengfei.github.com/ggbio/

Attaching package: 'ggbio'

The following objects are masked from 'package:ggplot2':

    geom_bar, geom_rect, geom_segment, ggsave, stat_bin, stat_identity,
    xlim

>   library(GenomicRanges)
>   library(BSgenome.Hsapiens.UCSC.hg19)
Loading required package: BSgenome
Loading required package: rtracklayer
>
>   region = GRanges("chr17", IRanges(7572100, width = 1))
>
>   control_bam = system.file("extdata", "platinum", "control.bam", package =
+   "Rariant", mustWork = TRUE)
>   mix_bam = system.file("extdata", "platinum", "mix.bam", package = "Rariant",
+   mustWork = TRUE)
>
>   bam_files = c(control_bam, mix_bam)
>
>   region = GRanges("chr17", IRanges(7572050, width = 100))
>
>   control_bam = system.file("extdata", "platinum", "control.bam", package =
+     "Rariant", mustWork = TRUE)
>   test1_bam = system.file("extdata", "platinum", "test.bam", package =
+     "Rariant", mustWork = TRUE)
>   test2_bam = system.file("extdata", "platinum", "test2.bam", package =
+     "Rariant", mustWork = TRUE)
>   mix_bam = system.file("extdata", "platinum", "mix.bam", package =
+     "Rariant", mustWork = TRUE)
>
>   bam_files = c(control_bam, test1_bam, test2_bam, mix_bam)
>
>   library(BSgenome.Hsapiens.UCSC.hg19)
>   ref = BSgenome.Hsapiens.UCSC.hg19
>
>   p = tracks(lapply(bam_files, tallyPlot, region, ref, minQual = 25))
Scale for 'x' is already present. Adding another scale for 'x', which will
replace the existing scale.
Scale for 'x' is already present. Adding another scale for 'x', which will
replace the existing scale.
Scale for 'x' is already present. Adding another scale for 'x', which will
replace the existing scale.
Scale for 'x' is already present. Adding another scale for 'x', which will
replace the existing scale.
>
>   print(p)
>
>
>
>
>
> dev.off()
null device
          1
>
|
Created & Maintained by Osamu Ogasawara (osamu.ogasawara@gmail.com) and 