Supported by Dr. Osamu Ogasawara and  . . |
|
Last data update: 2014.03.03 |
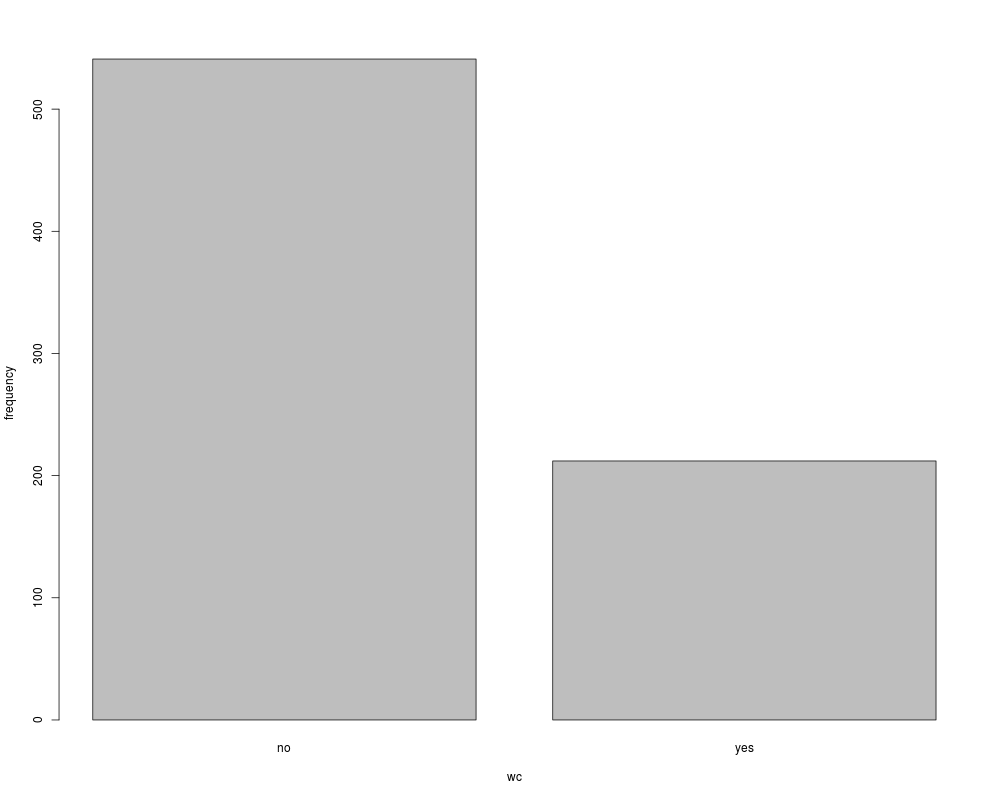
Bar PlotsDescriptionCreate bar plots for one or two factors scaled by frequency or precentages.
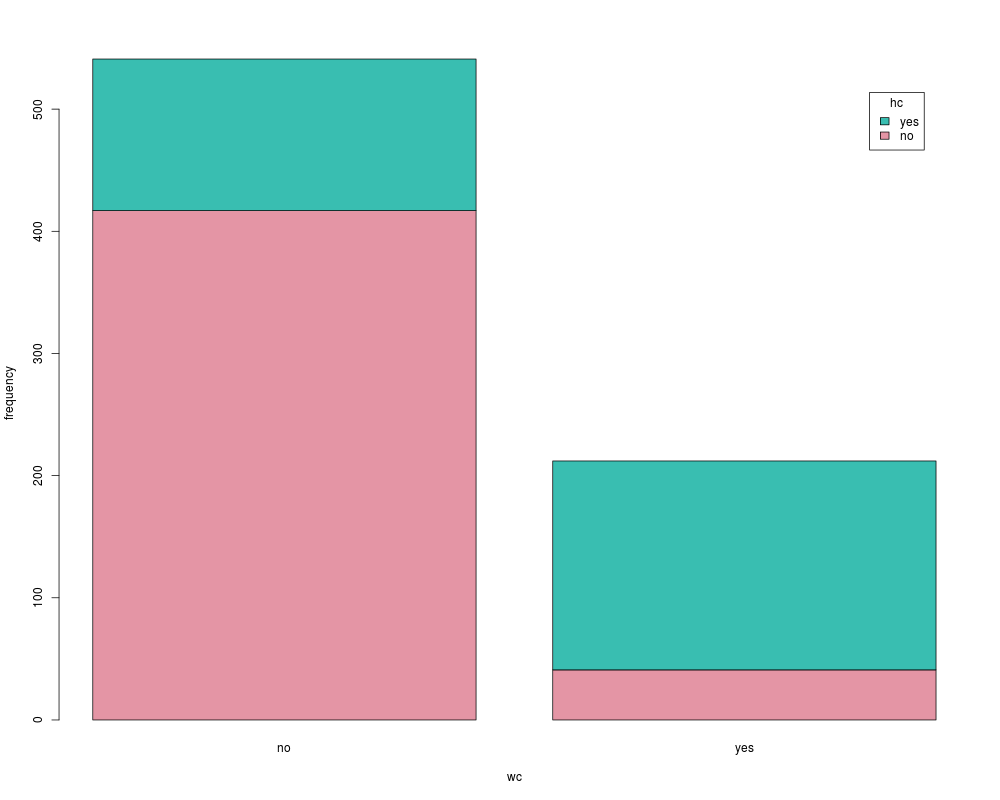
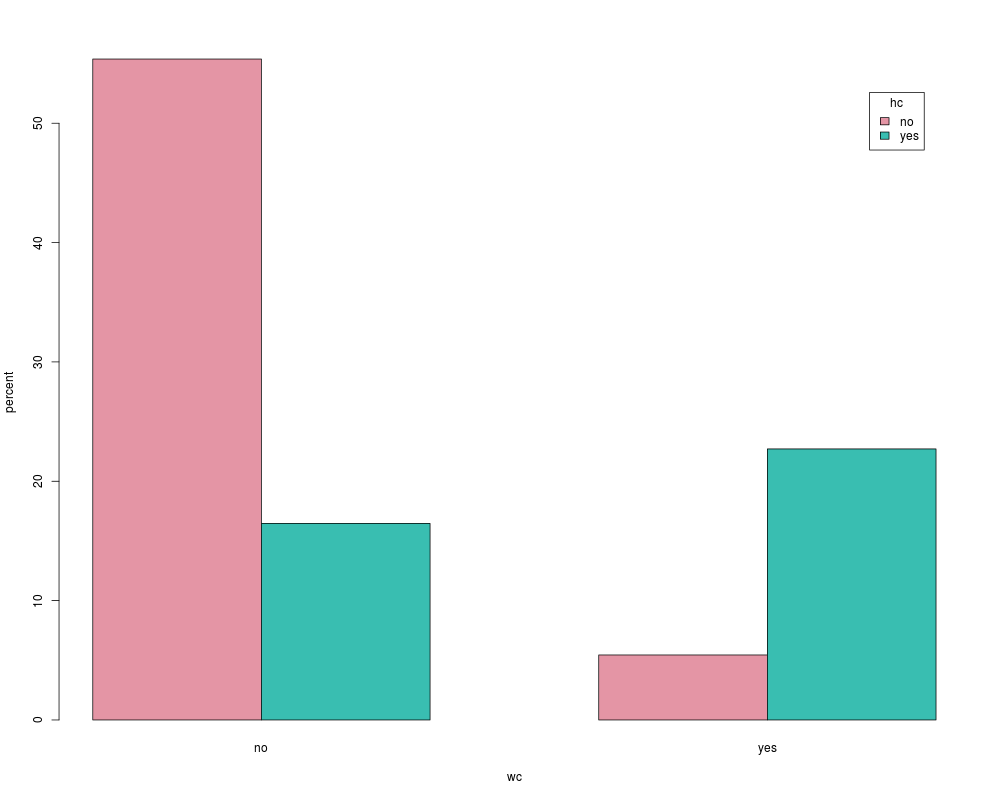
In the case of two factors, the bars can be divided (stacked) or plotted in
parallel (side-by-side). This function is a front end to Usage
Barplot(x, by, scale = c("frequency", "percent"),
  style = c("divided", "parallel"), col = rainbow_hcl(length(levels(by))),
  xlab = deparse(substitute(x)), legend.title = deparse(substitute(by)),
  ylab = scale, legend.pos = "topright", ...)
Arguments
ValueReturns Author(s)John Fox jfox@mcmaster.ca See Also
Examples
if (require(car)){
    data(Mroz)
    with(Mroz, {
      Barplot(wc)
      Barplot(wc, by=hc)
      Barplot(wc, by=hc, style="parallel", scale="percent")
    })
}
Results
R version 3.3.1 (2016-06-21) -- "Bug in Your Hair"
Copyright (C) 2016 The R Foundation for Statistical Computing
Platform: x86_64-pc-linux-gnu (64-bit)

R is free software and comes with ABSOLUTELY NO WARRANTY.
You are welcome to redistribute it under certain conditions.
Type 'license()' or 'licence()' for distribution details.

R is a collaborative project with many contributors.
Type 'contributors()' for more information and
'citation()' on how to cite R or R packages in publications.

Type 'demo()' for some demos, 'help()' for on-line help, or
'help.start()' for an HTML browser interface to help.
Type 'q()' to quit R.

> library(RcmdrMisc)
Loading required package: car
Loading required package: sandwich
> png(filename="/home/ddbj/snapshot/RGM3/R_CC/result/RcmdrMisc/Barplot.Rd_%03d_medium.png", width=480, height=480)
> ### Name: Barplot
> ### Title: Bar Plots
> ### Aliases: Barplot
> ### Keywords: hplot
>
> ### ** Examples
>
> if (require(car)){
+     data(Mroz)
+     with(Mroz, {
+       Barplot(wc)
+       Barplot(wc, by=hc)
+       Barplot(wc, by=hc, style="parallel", scale="percent")
+     })
+ }
>
>
>
>
>
> dev.off()
null device
          1
>
|