Supported by Dr. Osamu Ogasawara and  . . |
|
Last data update: 2014.03.03 |
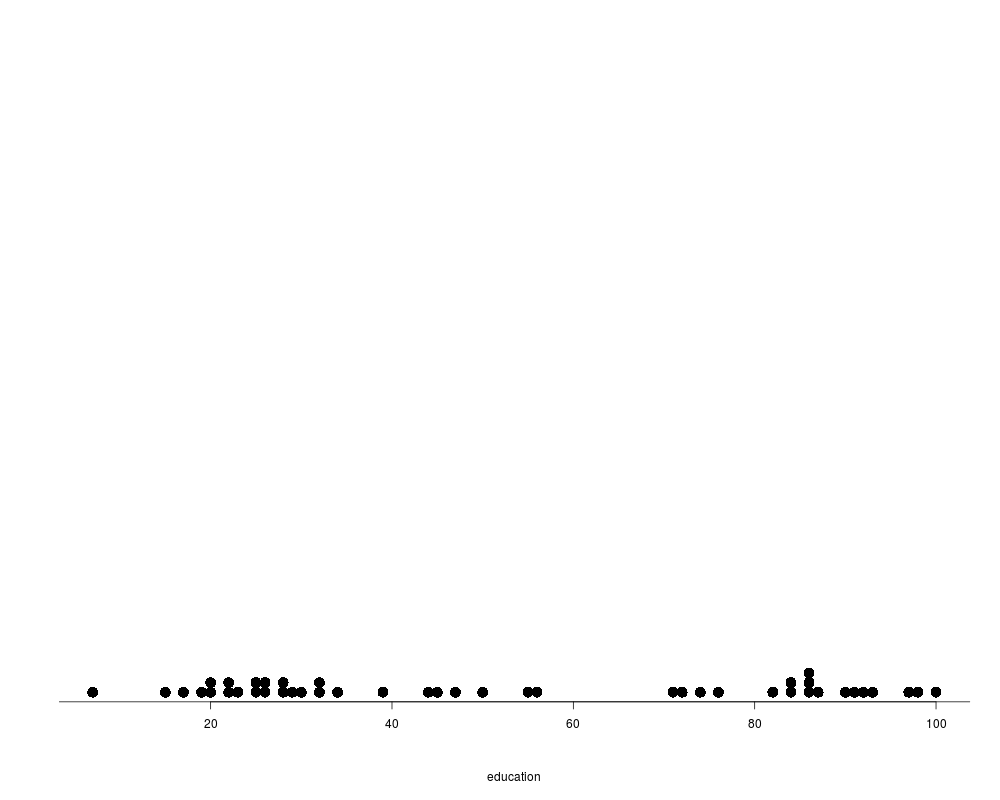
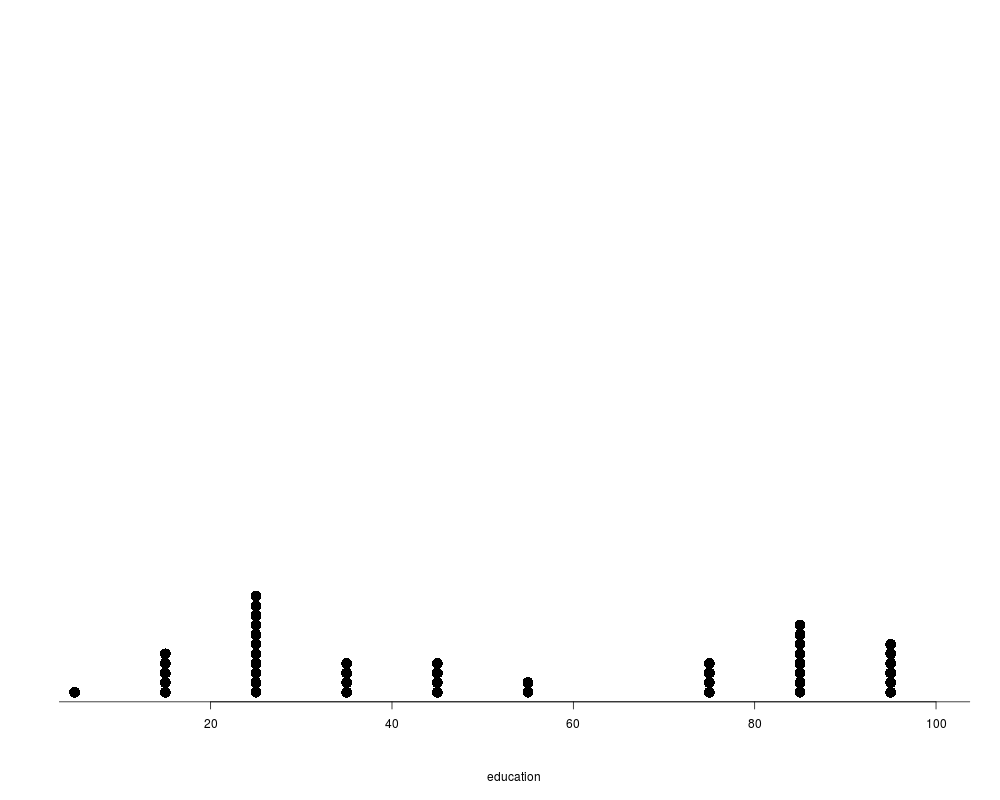
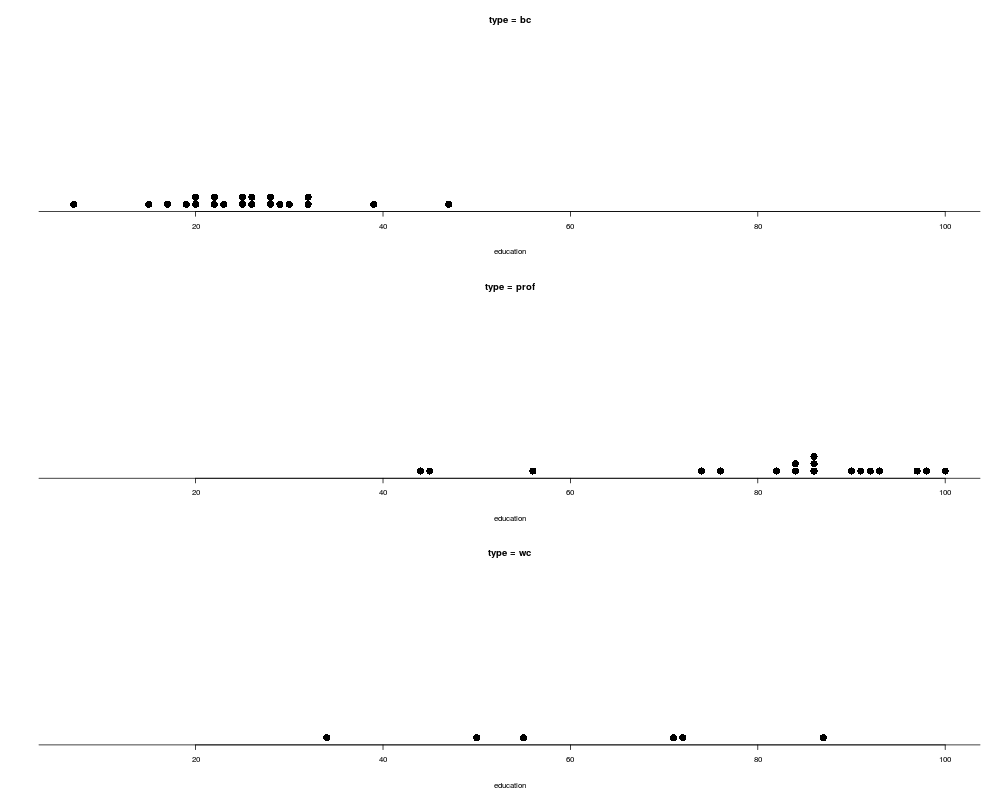
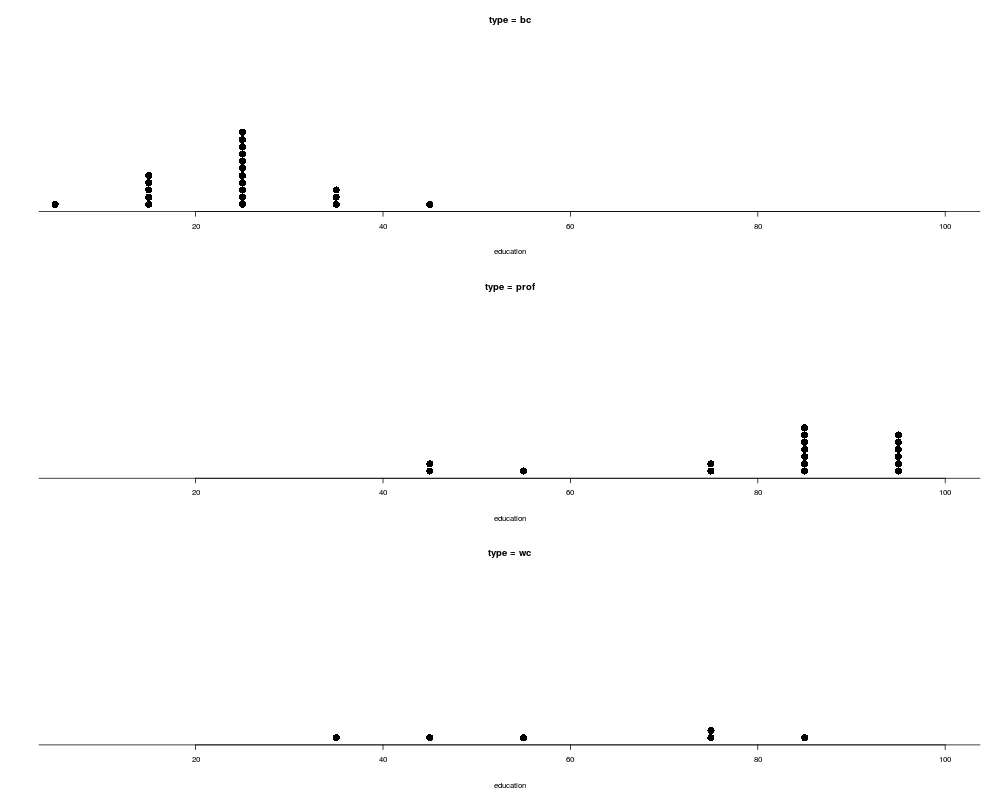
Dot PlotsDescriptionDot plot of numeric variable, either using raw values or binned, optionally classified by a factor. Dot plots are useful for visualizing the distrbution of a numeric variable in a small data set. Usage
Dotplot(x, by, bin = FALSE, breaks, xlim,
    xlab = deparse(substitute(x)))
Arguments
DetailsIf the ValueReturns Author(s)John Fox jfox@mcmaster.ca See Also
Examples
if (require(car)){
  data(Duncan)
  with(Duncan, {
    Dotplot(education)
    Dotplot(education, bin=TRUE)
    Dotplot(education, by=type)
    Dotplot(education, by=type, bin=TRUE)
  })
}
Results
R version 3.3.1 (2016-06-21) -- "Bug in Your Hair"
Copyright (C) 2016 The R Foundation for Statistical Computing
Platform: x86_64-pc-linux-gnu (64-bit)

R is free software and comes with ABSOLUTELY NO WARRANTY.
You are welcome to redistribute it under certain conditions.
Type 'license()' or 'licence()' for distribution details.

R is a collaborative project with many contributors.
Type 'contributors()' for more information and
'citation()' on how to cite R or R packages in publications.

Type 'demo()' for some demos, 'help()' for on-line help, or
'help.start()' for an HTML browser interface to help.
Type 'q()' to quit R.

> library(RcmdrMisc)
Loading required package: car
Loading required package: sandwich
> png(filename="/home/ddbj/snapshot/RGM3/R_CC/result/RcmdrMisc/Dotplot.Rd_%03d_medium.png", width=480, height=480)
> ### Name: Dotplot
> ### Title: Dot Plots
> ### Aliases: Dotplot
> ### Keywords: hplot
>
> ### ** Examples
>
> if (require(car)){
+   data(Duncan)
+   with(Duncan, {
+     Dotplot(education)
+     Dotplot(education, bin=TRUE)
+     Dotplot(education, by=type)
+     Dotplot(education, by=type, bin=TRUE)
+   })
+ }
>
>
>
>
>
> dev.off()
null device
          1
>
|