Supported by Dr. Osamu Ogasawara and  . . |
|
Last data update: 2014.03.03 |
Plot a probability density, mass, or distribution function.DescriptionThis function plots a probability density, mass, or distribution function, adapting the form of the plot as appropriate. UsageplotDistr(x, p, discrete=FALSE, cdf=FALSE, ...) Arguments
ValueProduces a plot; returns Author(s)John Fox jfox@mcmaster.ca Examples
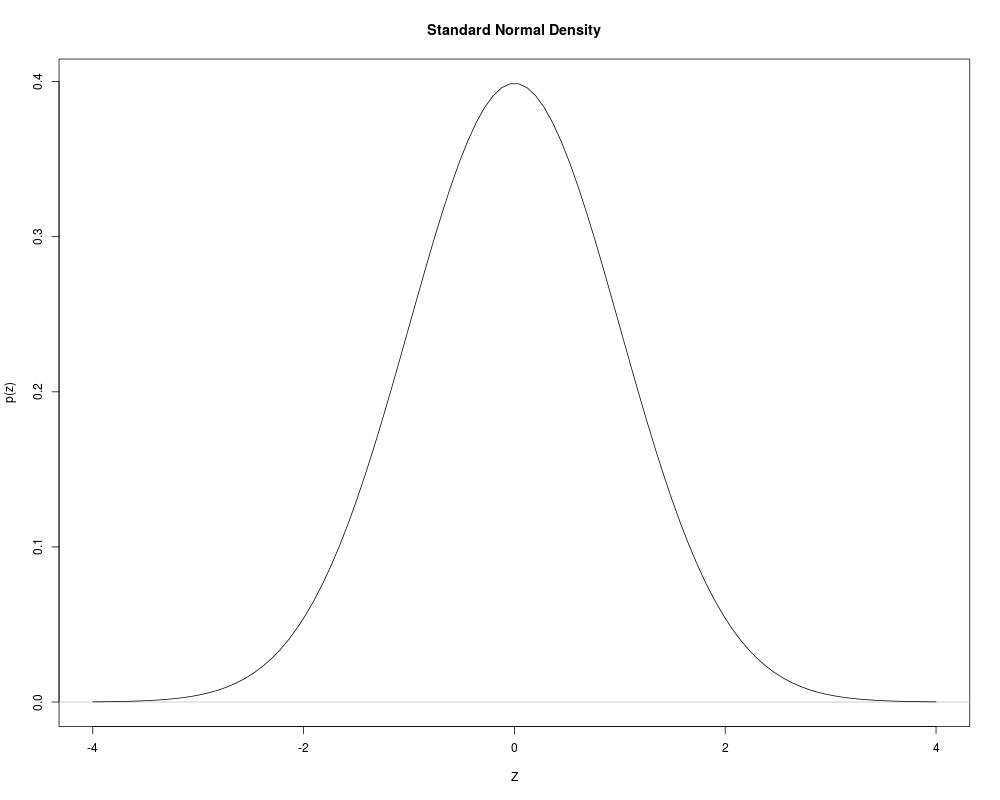
x <- seq(-4, 4, length=100)
plotDistr(x, dnorm(x), xlab="Z", ylab="p(z)", main="Standard Normal Density")
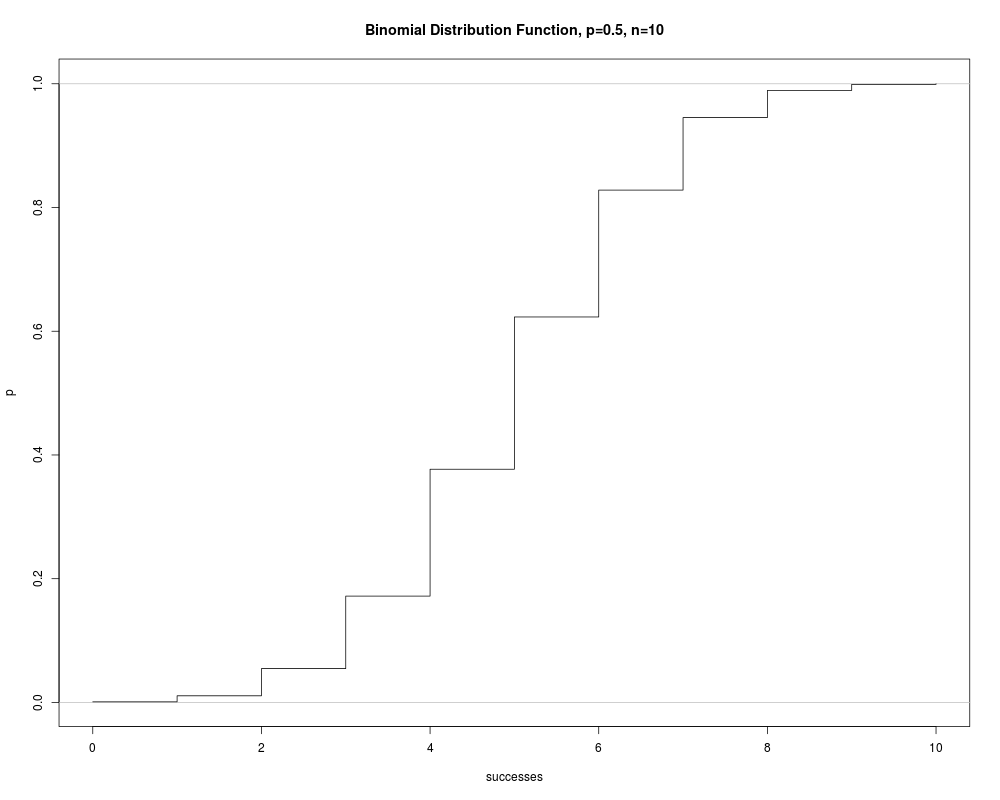
x <- 0:10
plotDistr(x, pbinom(x, 10, 0.5), xlab="successes",
discrete=TRUE, cdf=TRUE,
main="Binomial Distribution Function, p=0.5, n=10")
Results
R version 3.3.1 (2016-06-21) -- "Bug in Your Hair"
Copyright (C) 2016 The R Foundation for Statistical Computing
Platform: x86_64-pc-linux-gnu (64-bit)

R is free software and comes with ABSOLUTELY NO WARRANTY.
You are welcome to redistribute it under certain conditions.
Type 'license()' or 'licence()' for distribution details.

R is a collaborative project with many contributors.
Type 'contributors()' for more information and
'citation()' on how to cite R or R packages in publications.

Type 'demo()' for some demos, 'help()' for on-line help, or
'help.start()' for an HTML browser interface to help.
Type 'q()' to quit R.

> library(RcmdrMisc)
Loading required package: car
Loading required package: sandwich
> png(filename="/home/ddbj/snapshot/RGM3/R_CC/result/RcmdrMisc/plotDistr.Rd_%03d_medium.png", width=480, height=480)
> ### Name: plotDistr
> ### Title: Plot a probability density, mass, or distribution function.
> ### Aliases: plotDistr
> ### Keywords: hplot
>
> ### ** Examples
>
> x <- seq(-4, 4, length=100)
> plotDistr(x, dnorm(x), xlab="Z", ylab="p(z)", main="Standard Normal Density")
>
> x <- 0:10
> plotDistr(x, pbinom(x, 10, 0.5), xlab="successes",
+     discrete=TRUE, cdf=TRUE,
+     main="Binomial Distribution Function, p=0.5, n=10")
>
>
>
>
>
> dev.off()
null device
          1
>
|
Created & Maintained by Osamu Ogasawara (osamu.ogasawara@gmail.com) and 