Supported by Dr. Osamu Ogasawara and  . . |
|
Last data update: 2014.03.03 |
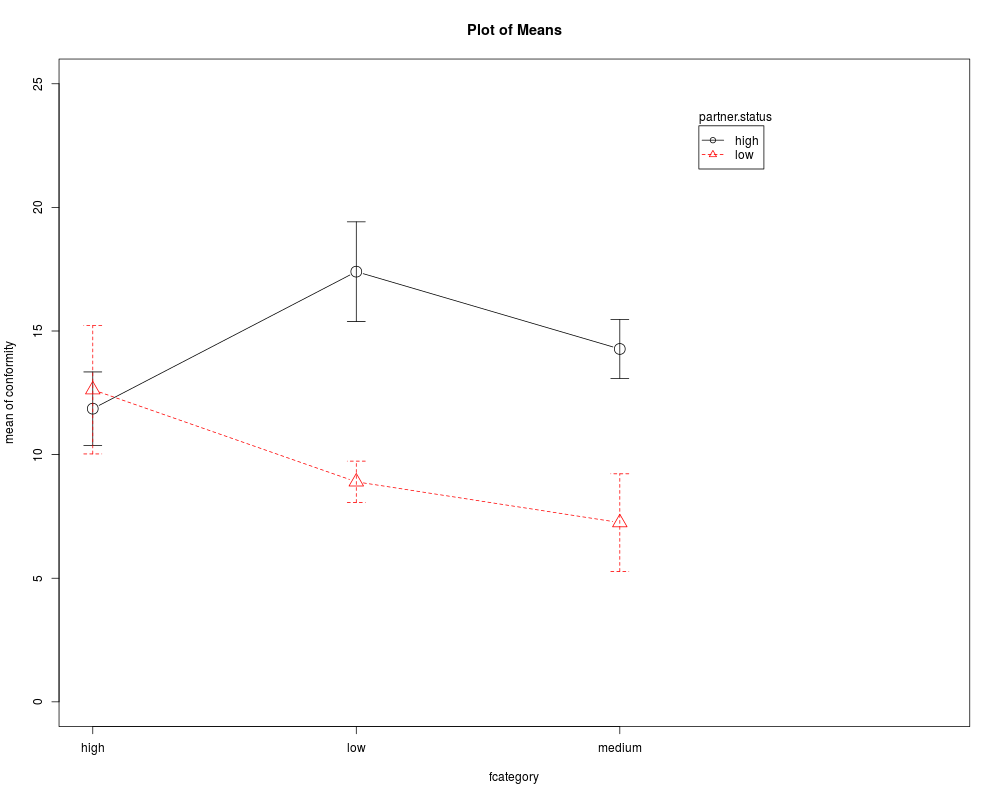
Plot Means for One or Two-Way LayoutDescriptionPlots cell means for a numeric variable in each category of a factor or in each combination of categories of two factors, optionally along with error bars based on cell standard errors or standard deviations. Usage
plotMeans(response, factor1, factor2,
    error.bars = c("se", "sd", "conf.int", "none"), level=0.95,
    xlab = deparse(substitute(factor1)),
    ylab = paste("mean of", deparse(substitute(response))),
    legend.lab = deparse(substitute(factor2)), main = "Plot of Means",
    pch = 1:n.levs.2, lty = 1:n.levs.2, col = palette(), ...)
Arguments
ValueThe function invisibly returns Author(s)John Fox jfox@mcmaster.ca See Also
Examples
if (require(car)){
    data(Moore)
    with(Moore, plotMeans(conformity, fcategory, partner.status, ylim=c(0, 25)))
}
Results
R version 3.3.1 (2016-06-21) -- "Bug in Your Hair"
Copyright (C) 2016 The R Foundation for Statistical Computing
Platform: x86_64-pc-linux-gnu (64-bit)

R is free software and comes with ABSOLUTELY NO WARRANTY.
You are welcome to redistribute it under certain conditions.
Type 'license()' or 'licence()' for distribution details.

R is a collaborative project with many contributors.
Type 'contributors()' for more information and
'citation()' on how to cite R or R packages in publications.

Type 'demo()' for some demos, 'help()' for on-line help, or
'help.start()' for an HTML browser interface to help.
Type 'q()' to quit R.

> library(RcmdrMisc)
Loading required package: car
Loading required package: sandwich
> png(filename="/home/ddbj/snapshot/RGM3/R_CC/result/RcmdrMisc/plotMeans.Rd_%03d_medium.png", width=480, height=480)
> ### Name: plotMeans
> ### Title: Plot Means for One or Two-Way Layout
> ### Aliases: plotMeans
> ### Keywords: hplot
>
> ### ** Examples
>
> if (require(car)){
+     data(Moore)
+     with(Moore, plotMeans(conformity, fcategory, partner.status, ylim=c(0, 25)))
+ }
>
>
>
>
>
> dev.off()
null device
          1
>
|