Supported by Dr. Osamu Ogasawara and  . . |
|
Last data update: 2014.03.03 |
Render a laid out graph objectDescriptionThis method uses the Usage## S4 method for signature 'graph' renderGraph(x, ..., drawNodes="renderNodes", drawEdges=renderEdges, graph.pars=list()) Arguments
DetailsThis method can render graph objects that have previously been laid
out using the function ValueAn object derived from class Author(s)Florian Hahne See Also
Examples
set.seed(123)
V <- letters[1:5]
M <- 1:2
g1 <- randomGraph(V, M, 0.5)
edgemode(g1) <- "directed"
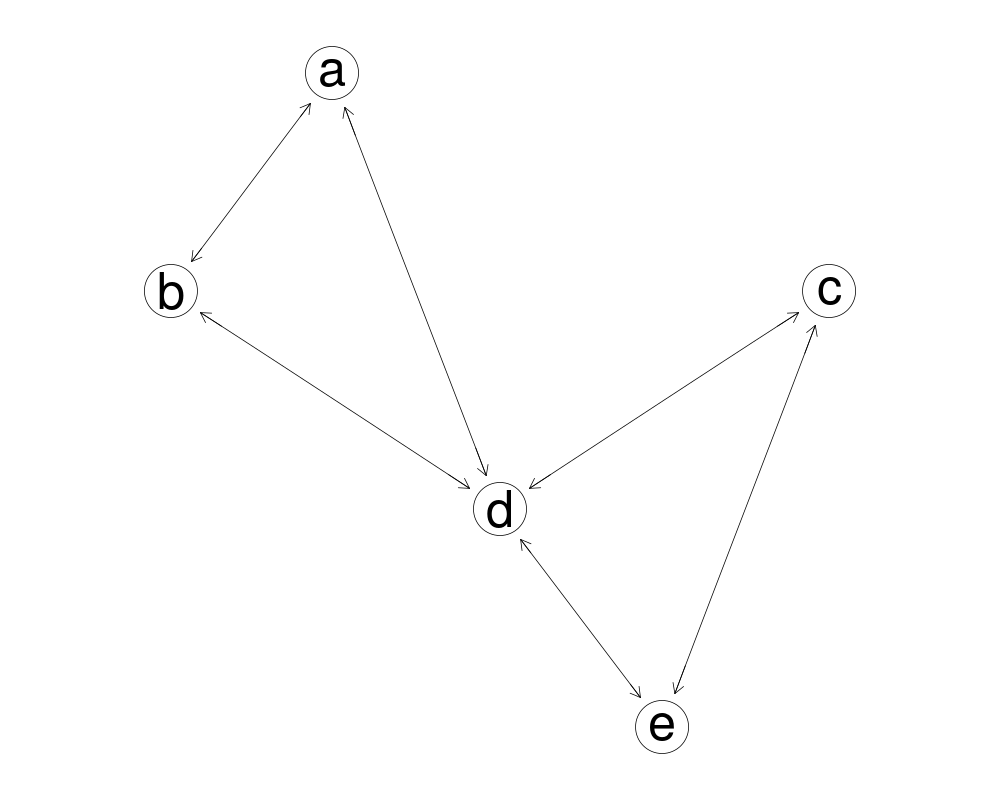
x <- layoutGraph(g1)
renderGraph(x)
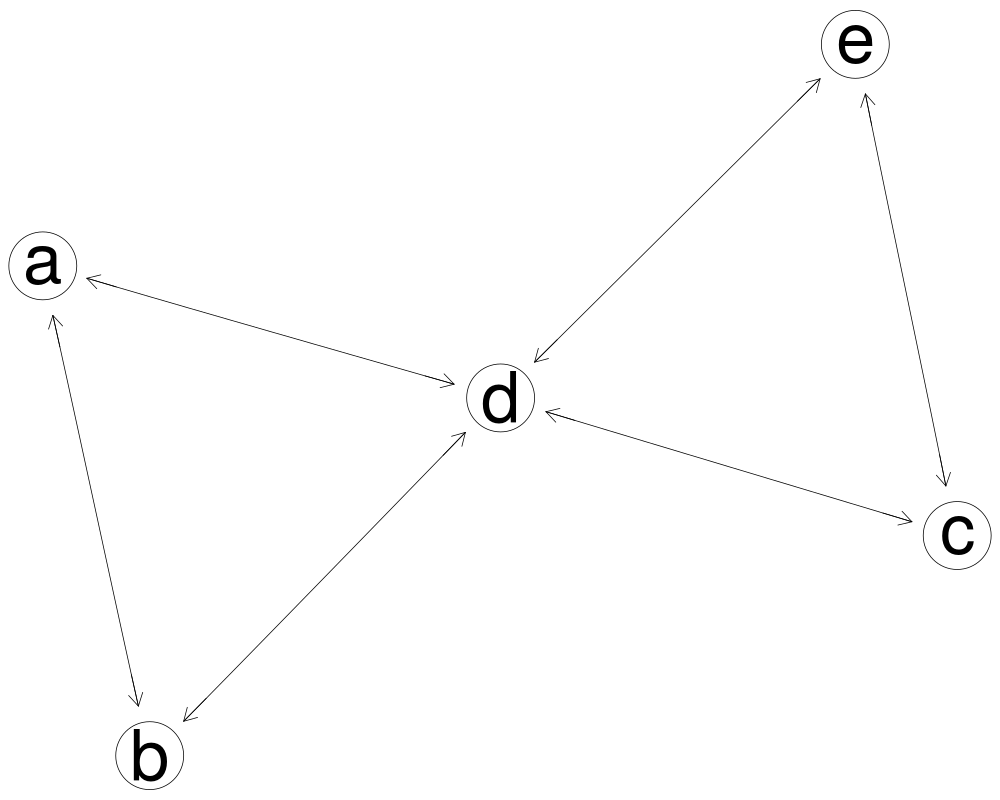
## one of Graphviz's additional layout algorithms
x <- layoutGraph(g1, layoutType="neato")
renderGraph(x)
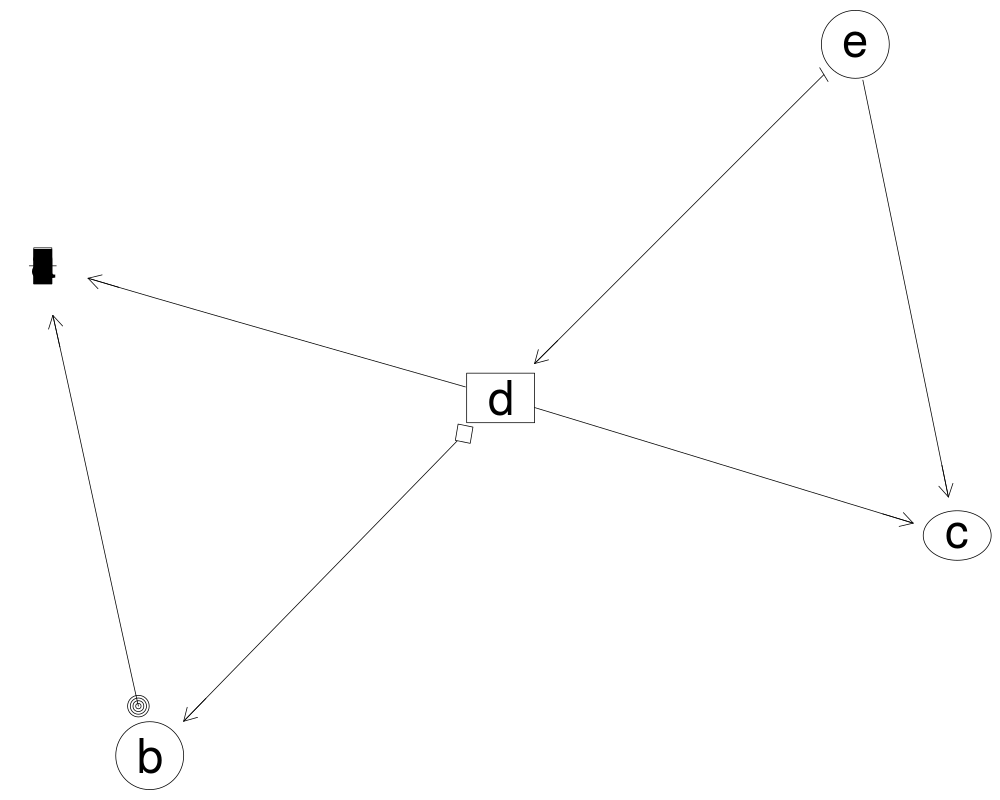
## some tweaks to Graphviz's node and edge attributes,
## including a user-defined arrowhead and node shape functions.
myArrows <- function(x, ...)
{
for(i in 1:4)
points(x,cex=i)
}
myNode <- function(x, col, fill, ...)
symbols(x=mean(x[,1]), y=mean(x[,2]), thermometers=cbind(.5, 1,
runif(1)), inches=0.5,
fg=col, bg=fill, add=TRUE)
eAtt <- list(arrowhead=c("a~b"=myArrows, "b~d"="odiamond", "d~e"="tee"))
nAtt <- list(shape=c(d="box", c="ellipse", a=myNode))
edgemode(g1) <- "directed"
x <- layoutGraph(g1, edgeAttrs=eAtt, nodeAttrs=nAtt, layoutType="neato")
renderGraph(x)
Results
R version 3.3.1 (2016-06-21) -- "Bug in Your Hair"
Copyright (C) 2016 The R Foundation for Statistical Computing
Platform: x86_64-pc-linux-gnu (64-bit)

R is free software and comes with ABSOLUTELY NO WARRANTY.
You are welcome to redistribute it under certain conditions.
Type 'license()' or 'licence()' for distribution details.

R is a collaborative project with many contributors.
Type 'contributors()' for more information and
'citation()' on how to cite R or R packages in publications.

Type 'demo()' for some demos, 'help()' for on-line help, or
'help.start()' for an HTML browser interface to help.
Type 'q()' to quit R.

> library(Rgraphviz)
Loading required package: graph
Loading required package: BiocGenerics
Loading required package: parallel

Attaching package: 'BiocGenerics'

The following objects are masked from 'package:parallel':

    clusterApply, clusterApplyLB, clusterCall, clusterEvalQ,
    clusterExport, clusterMap, parApply, parCapply, parLapply,
    parLapplyLB, parRapply, parSapply, parSapplyLB

The following objects are masked from 'package:stats':

    IQR, mad, xtabs

The following objects are masked from 'package:base':

    Filter, Find, Map, Position, Reduce, anyDuplicated, append,
    as.data.frame, cbind, colnames, do.call, duplicated, eval, evalq,
    get, grep, grepl, intersect, is.unsorted, lapply, lengths, mapply,
    match, mget, order, paste, pmax, pmax.int, pmin, pmin.int, rank,
    rbind, rownames, sapply, setdiff, sort, table, tapply, union,
    unique, unsplit

Loading required package: grid
> png(filename="/home/ddbj/snapshot/RGM3/R_BC/result/Rgraphviz/renderGraph.Rd_%03d_medium.png", width=480, height=480)
> ### Name: renderGraph
> ### Title: Render a laid out graph object
> ### Aliases: renderGraph renderGraph,graph-method
> ### Keywords: methods
>
> ### ** Examples
>
>
> set.seed(123)
> V <- letters[1:5]
> M <- 1:2
> g1 <- randomGraph(V, M, 0.5)
> edgemode(g1) <- "directed"
> x <- layoutGraph(g1)
> renderGraph(x)
>
> ## one of Graphviz's additional layout algorithms
> x <- layoutGraph(g1, layoutType="neato")
> renderGraph(x)
>
> ## some tweaks to Graphviz's node and edge attributes,
> ## including a user-defined arrowhead and node shape functions.
> myArrows <- function(x, ...)
+ {
+ for(i in 1:4)
+ points(x,cex=i)
+ }
>
> myNode <- function(x, col, fill, ...)
+ symbols(x=mean(x[,1]), y=mean(x[,2]), thermometers=cbind(.5, 1,
+ runif(1)), inches=0.5,
+ fg=col, bg=fill, add=TRUE)
>
> eAtt <- list(arrowhead=c("a~b"=myArrows, "b~d"="odiamond", "d~e"="tee"))
> nAtt <- list(shape=c(d="box", c="ellipse", a=myNode))
> edgemode(g1) <- "directed"
> x <- layoutGraph(g1, edgeAttrs=eAtt, nodeAttrs=nAtt, layoutType="neato")
> renderGraph(x)
>
>
>
>
>
>
>
> dev.off()
null device
          1
>
|