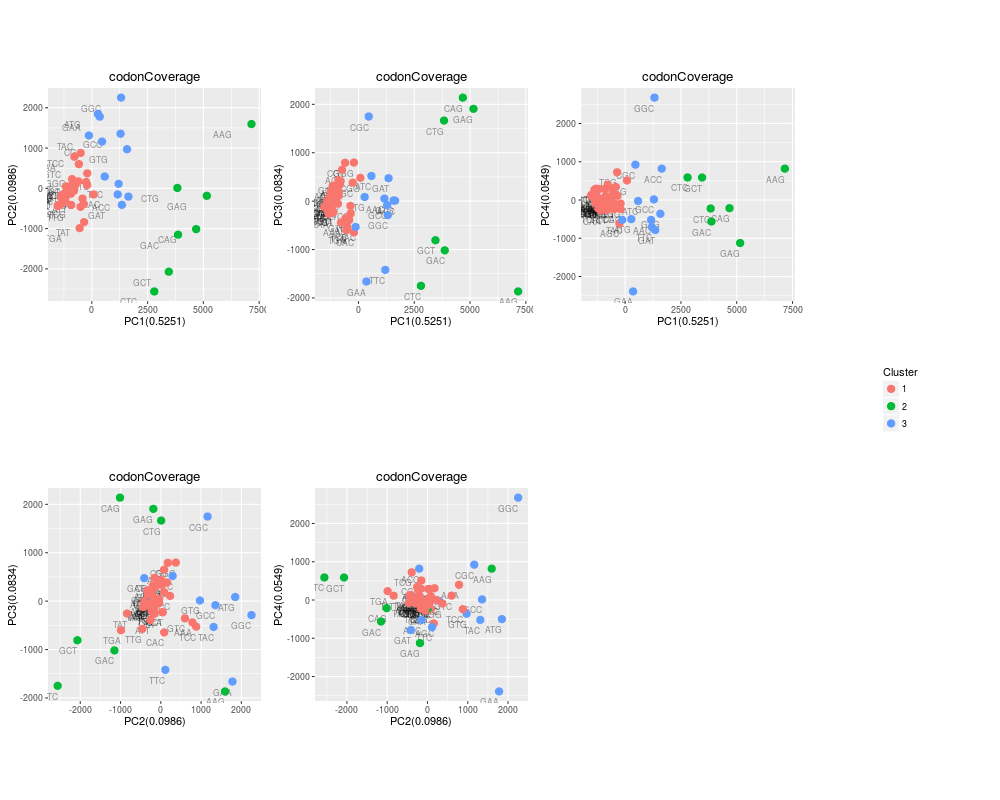
R: Plots the PCA scatterplots produced by codonPCA function.
printPCA
R Documentation
Plots the PCA scatterplots produced by codonPCA function.
Description
Plots the PCA scatterplots produced by codonPCA function.
Usage
printPCA(listPCAGraphs)
Arguments
listPCAGraphs
a list of 5 PCA ggplot scatterplots.
Value
a unique plot with the 5 PCA scatterplots.
Examples
#How to perform a PCA analysis based on codon coverage
data(codonDataCtrl)
codonData <- codonDataCtrl
codonUsage <- codonData[[1]]
codonCovMatrix <- codonData[[2]]

#keep only genes with a minimum number of reads
nbrReadsGene <- apply(codonCovMatrix, 1, sum)
ixExpGenes <- which(nbrReadsGene >= 50)
codonCovMatrix <- codonCovMatrix[ixExpGenes, ]

#get the PCA on the codon coverage
codonCovMatrixTransp <- t(codonCovMatrix)
rownames(codonCovMatrixTransp) <- colnames(codonCovMatrix)
colnames(codonCovMatrixTransp) <- rownames(codonCovMatrix)

listPCACodonCoverage <- codonPCA(codonCovMatrixTransp,"codonCoverage")
printPCA(listPCACodonCoverage[[2]])
Results
R version 3.3.1 (2016-06-21) -- "Bug in Your Hair"
Copyright (C) 2016 The R Foundation for Statistical Computing
Platform: x86_64-pc-linux-gnu (64-bit)

R is free software and comes with ABSOLUTELY NO WARRANTY.
You are welcome to redistribute it under certain conditions.
Type 'license()' or 'licence()' for distribution details.

R is a collaborative project with many contributors.
Type 'contributors()' for more information and
'citation()' on how to cite R or R packages in publications.

Type 'demo()' for some demos, 'help()' for on-line help, or
'help.start()' for an HTML browser interface to help.
Type 'q()' to quit R.

> library(RiboProfiling)
Loading required package: Biostrings
Loading required package: BiocGenerics
Loading required package: parallel

Attaching package: 'BiocGenerics'

The following objects are masked from 'package:parallel':

    clusterApply, clusterApplyLB, clusterCall, clusterEvalQ,
    clusterExport, clusterMap, parApply, parCapply, parLapply,
    parLapplyLB, parRapply, parSapply, parSapplyLB

The following objects are masked from 'package:stats':

    IQR, mad, xtabs

The following objects are masked from 'package:base':

    Filter, Find, Map, Position, Reduce, anyDuplicated, append,
    as.data.frame, cbind, colnames, do.call, duplicated, eval, evalq,
    get, grep, grepl, intersect, is.unsorted, lapply, lengths, mapply,
    match, mget, order, paste, pmax, pmax.int, pmin, pmin.int, rank,
    rbind, rownames, sapply, setdiff, sort, table, tapply, union,
    unique, unsplit

Loading required package: S4Vectors
Loading required package: stats4

Attaching package: 'S4Vectors'

The following objects are masked from 'package:base':

    colMeans, colSums, expand.grid, rowMeans, rowSums

Loading required package: IRanges
Loading required package: XVector
Warning messages:
1: replacing previous import 'BiocGenerics::Position' by 'ggplot2::Position' when loading 'RiboProfiling'
2: replacing previous import 'ggplot2::Position' by 'BiocGenerics::Position' when loading 'ggbio'
> png(filename="/home/ddbj/snapshot/RGM3/R_BC/result/RiboProfiling/printPCA.Rd_%03d_medium.png", width=480, height=480)
> ### Name: printPCA
> ### Title: Plots the PCA scatterplots produced by codonPCA function.
> ### Aliases: printPCA
>
> ### ** Examples
>
> #How to perform a PCA analysis based on codon coverage
> data(codonDataCtrl)
> codonData <- codonDataCtrl
> codonUsage <- codonData[[1]]
> codonCovMatrix <- codonData[[2]]
>
> #keep only genes with a minimum number of reads
> nbrReadsGene <- apply(codonCovMatrix, 1, sum)
> ixExpGenes <- which(nbrReadsGene >= 50)
> codonCovMatrix <- codonCovMatrix[ixExpGenes, ]
>
> #get the PCA on the codon coverage
> codonCovMatrixTransp <- t(codonCovMatrix)
> rownames(codonCovMatrixTransp) <- colnames(codonCovMatrix)
> colnames(codonCovMatrixTransp) <- rownames(codonCovMatrix)
>
> listPCACodonCoverage <- codonPCA(codonCovMatrixTransp,"codonCoverage")
> printPCA(listPCACodonCoverage[[2]])
TableGrob (1 x 2) "arrange": 2 grobs
  z     cells    name            grob
1 1 (1-1,1-1) arrange gtable[arrange]
2 2 (1-1,2-2) arrange gtable[arrange]
>
>
>
>
>
> dev.off()
null device
          1
>
 .
.