Supported by Dr. Osamu Ogasawara and  . . |
|
Last data update: 2014.03.03 |
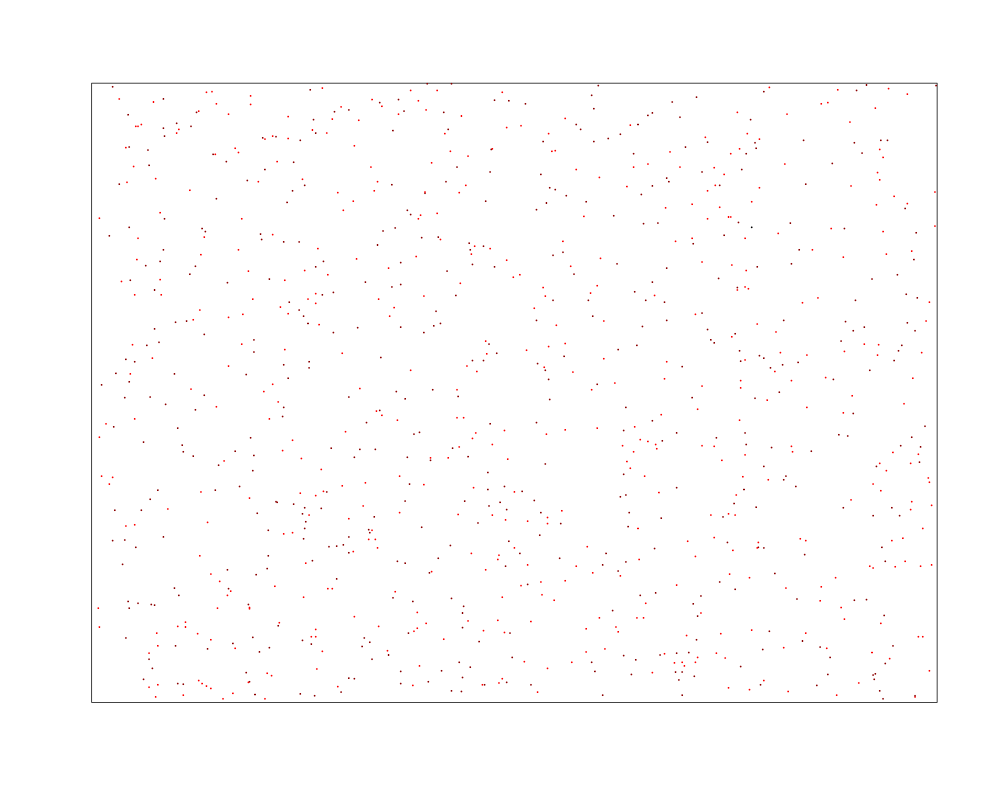
Function to visualize spatial distribution of raw intensitiesDescriptionFunction to visualize spatial distribution of raw intensities on
NimbleGen Oligoarrays. Requires Usage
## S3 method for class 'RGList'
image(x,arrayno,channel=c("red","green","logratio"),
         mycols=NULL, mybreaks=NULL, dim1="X", dim2="Y",
         ppch=20, pcex=0.3, verbose=TRUE, ...)
Arguments
Valueinvisibly returns NULL; function is called for its side effect, this is producing the plot Author(s)Joern Toedling See Also
Examples
   exDir <- system.file("exData",package="Ringo")
   exRG <- readNimblegen("example_targets.txt","spottypes.txt",path=exDir)
   image(exRG, 1, channel="red", mycols=c("black","darkred","red"))
   ## this example looks strange because the example data files only
   ## includes the probe intensities of probes mapped to the forward
   ## strand of chromosome 9.
   ## you can see these probes are distributed all over the array
Results
R version 3.3.1 (2016-06-21) -- "Bug in Your Hair"
Copyright (C) 2016 The R Foundation for Statistical Computing
Platform: x86_64-pc-linux-gnu (64-bit)

R is free software and comes with ABSOLUTELY NO WARRANTY.
You are welcome to redistribute it under certain conditions.
Type 'license()' or 'licence()' for distribution details.

R is a collaborative project with many contributors.
Type 'contributors()' for more information and
'citation()' on how to cite R or R packages in publications.

Type 'demo()' for some demos, 'help()' for on-line help, or
'help.start()' for an HTML browser interface to help.
Type 'q()' to quit R.

> library(Ringo)
Loading required package: Biobase
Loading required package: BiocGenerics
Loading required package: parallel

Attaching package: 'BiocGenerics'

The following objects are masked from 'package:parallel':

    clusterApply, clusterApplyLB, clusterCall, clusterEvalQ,
    clusterExport, clusterMap, parApply, parCapply, parLapply,
    parLapplyLB, parRapply, parSapply, parSapplyLB

The following objects are masked from 'package:stats':

    IQR, mad, xtabs

The following objects are masked from 'package:base':

    Filter, Find, Map, Position, Reduce, anyDuplicated, append,
    as.data.frame, cbind, colnames, do.call, duplicated, eval, evalq,
    get, grep, grepl, intersect, is.unsorted, lapply, lengths, mapply,
    match, mget, order, paste, pmax, pmax.int, pmin, pmin.int, rank,
    rbind, rownames, sapply, setdiff, sort, table, tapply, union,
    unique, unsplit

Welcome to Bioconductor

    Vignettes contain introductory material; view with
    'browseVignettes()'. To cite Bioconductor, see
    'citation("Biobase")', and for packages 'citation("pkgname")'.

Loading required package: RColorBrewer
Loading required package: limma

Attaching package: 'limma'

The following object is masked from 'package:BiocGenerics':

    plotMA

Loading required package: Matrix
Loading required package: grid
Loading required package: lattice
> png(filename="/home/ddbj/snapshot/RGM3/R_BC/result/Ringo/arrayImage.Rd_%03d_medium.png", width=480, height=480)
> ### Name: image.RGList
> ### Title: Function to visualize spatial distribution of raw intensities
> ### Aliases: arrayImage image.RGList image,RGList-method
> ### Keywords: hplot
>
> ### ** Examples
>
>    exDir <- system.file("exData",package="Ringo")
>    exRG <- readNimblegen("example_targets.txt","spottypes.txt",path=exDir)
Reading targets file...
Reading raw intensities...
Read header information
Read /home/ddbj/local/lib64/R/library/Ringo/exData/MOD_20551_PMT1_pair.txt
Read /home/ddbj/local/lib64/R/library/Ringo/exData/MOD_20742_PMT1_pair.txt
Determining probe categories...
Matching patterns for: GENE_EXPR_OPTION PROBE_ID
Found 991 Probe
Found 0 Probe
Found 0 Probe
Found 0 Negative
Found 0 Empty
Found 0 H_Code
Found 0 V_Code
Found 0 Random
Setting attributes: values Color
>    image(exRG, 1, channel="red", mycols=c("black","darkred","red"))
Dimensions of array: 765 x 1017 .
>    ## this example looks strange because the example data files only
>    ## includes the probe intensities of probes mapped to the forward
>    ## strand of chromosome 9.
>    ## you can see these probes are distributed all over the array
>
>
>
>
>
> dev.off()
null device
          1
>
|