Supported by Dr. Osamu Ogasawara and  . . |
|
Last data update: 2014.03.03 |
Function to identify chers based on thresholdsDescriptionGiven a vector of probe positions on the chromosome, a vector of smoothed intensities on these positions, and a threshold for intensities to indicated enrichment, this function identifies Chers (ChIP-enriched regions) on this chromosome. This function is called by the function UsagecherByThreshold(positions, scores, threshold, distCutOff, minProbesInRow = 3) Arguments
DetailsSpecifying a minimum number of probes for a cher (argument
ValueA LIST with n components, where the first n components are the cher clusters, each one holding the scores and, as their names, the genomic positions of probes in that cluster. Author(s)Joern Toedling See Also
Examples
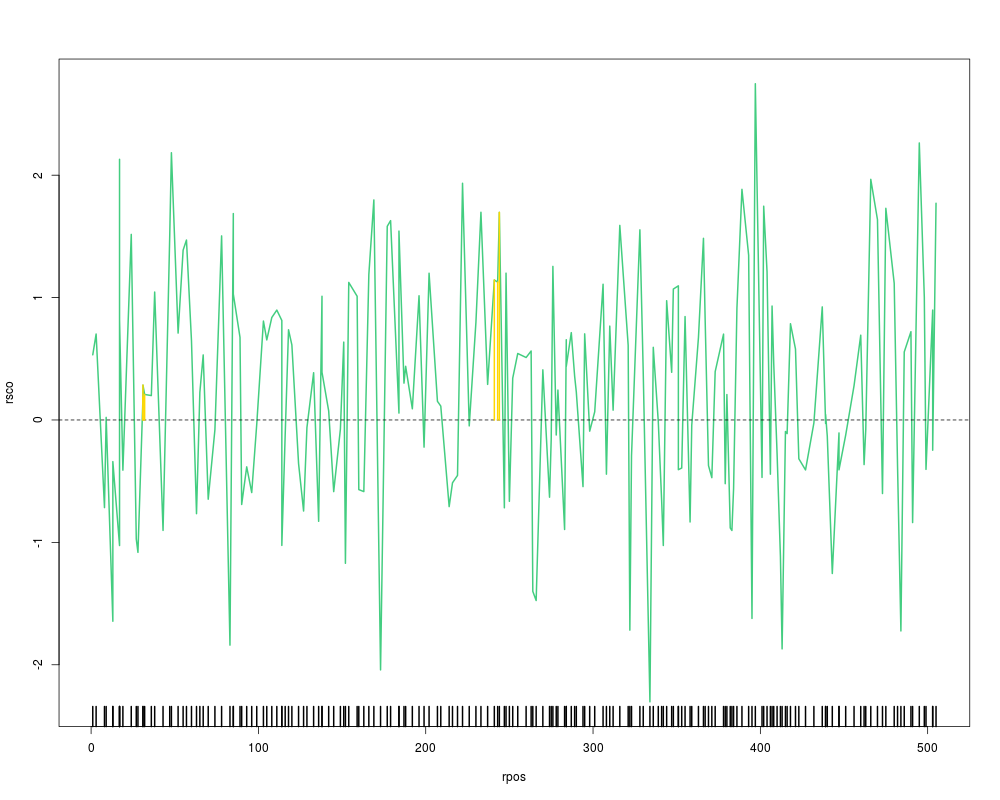
 ## example with random generated data:
 rpos <- cumsum(round(runif(200)*5))
 rsco <- rnorm(200)+0.2
 plot(rpos, rsco, type="l", col="seagreen3", lwd=2)
 rug(rpos, side=1, lwd=2); abline(h=0, lty=2)
 rchers <- cherByThreshold(rpos, rsco, threshold=0, distCutOff=2)
 sapply(rchers[-length(rchers)], function(thisClust){
  points(x=as.numeric(names(thisClust)), y=thisClust, type="h", lwd=2,
 col="gold")})
Results
R version 3.3.1 (2016-06-21) -- "Bug in Your Hair"
Copyright (C) 2016 The R Foundation for Statistical Computing
Platform: x86_64-pc-linux-gnu (64-bit)

R is free software and comes with ABSOLUTELY NO WARRANTY.
You are welcome to redistribute it under certain conditions.
Type 'license()' or 'licence()' for distribution details.

R is a collaborative project with many contributors.
Type 'contributors()' for more information and
'citation()' on how to cite R or R packages in publications.

Type 'demo()' for some demos, 'help()' for on-line help, or
'help.start()' for an HTML browser interface to help.
Type 'q()' to quit R.

> library(Ringo)
Loading required package: Biobase
Loading required package: BiocGenerics
Loading required package: parallel

Attaching package: 'BiocGenerics'

The following objects are masked from 'package:parallel':

    clusterApply, clusterApplyLB, clusterCall, clusterEvalQ,
    clusterExport, clusterMap, parApply, parCapply, parLapply,
    parLapplyLB, parRapply, parSapply, parSapplyLB

The following objects are masked from 'package:stats':

    IQR, mad, xtabs

The following objects are masked from 'package:base':

    Filter, Find, Map, Position, Reduce, anyDuplicated, append,
    as.data.frame, cbind, colnames, do.call, duplicated, eval, evalq,
    get, grep, grepl, intersect, is.unsorted, lapply, lengths, mapply,
    match, mget, order, paste, pmax, pmax.int, pmin, pmin.int, rank,
    rbind, rownames, sapply, setdiff, sort, table, tapply, union,
    unique, unsplit

Welcome to Bioconductor

    Vignettes contain introductory material; view with
    'browseVignettes()'. To cite Bioconductor, see
    'citation("Biobase")', and for packages 'citation("pkgname")'.

Loading required package: RColorBrewer
Loading required package: limma

Attaching package: 'limma'

The following object is masked from 'package:BiocGenerics':

    plotMA

Loading required package: Matrix
Loading required package: grid
Loading required package: lattice
> png(filename="/home/ddbj/snapshot/RGM3/R_BC/result/Ringo/cherByThreshold.Rd_%03d_medium.png", width=480, height=480)
> ### Name: cherByThreshold
> ### Title: Function to identify chers based on thresholds
> ### Aliases: cherByThreshold
> ### Keywords: manip
>
> ### ** Examples
>
>  ## example with random generated data:
>  rpos <- cumsum(round(runif(200)*5))
>  rsco <- rnorm(200)+0.2
>  plot(rpos, rsco, type="l", col="seagreen3", lwd=2)
>  rug(rpos, side=1, lwd=2); abline(h=0, lty=2)
>  rchers <- cherByThreshold(rpos, rsco, threshold=0, distCutOff=2)
>  sapply(rchers[-length(rchers)], function(thisClust){
+   points(x=as.numeric(names(thisClust)), y=thisClust, type="h", lwd=2,
+  col="gold")})
$cher1
NULL

$cher2
NULL

$cher3
NULL

$cher4
NULL

>
>
>
>
>
> dev.off()
null device
          1
>
|