Supported by Dr. Osamu Ogasawara and  . . |
|
Last data update: 2014.03.03 |
Class "cher" - ChIP-enriched regionDescriptionAn object of class Objects from the ClassObjects can be created by calls of the form
Slots
Methods
cherListA list in which each element is of class NoteThe The term 'cher' is shorthand for 'ChIP-enriched region'. We think this term is more appropriate than the term 'peak' commonly used in ChIP-chip context. Within such regions the actual signal could show two or more actual signal peaks or none at all (long plateau). Author(s)Joern Toedling, Tammo Krueger See Also
Examples
## how to create a cher object from scratch
cherNudt2 <- new("cher", name="nudt2.cher", chromosome=9,
start=34318954, end=34319944, antibody="Suz12",
maxLevel=2.00, score=69.2, upSymbol="NUDT2")
#extras=list(upSymbol="NUDT2"))
cherNudt2
str(cherNudt2)
## use the update method (note:this update is biologically meaningless)
cher2 <- update(cherNudt2, cellType="HeLa", downSymbol="P53",
probes=c("probe1","probe2"))
cher2; str(cher2)
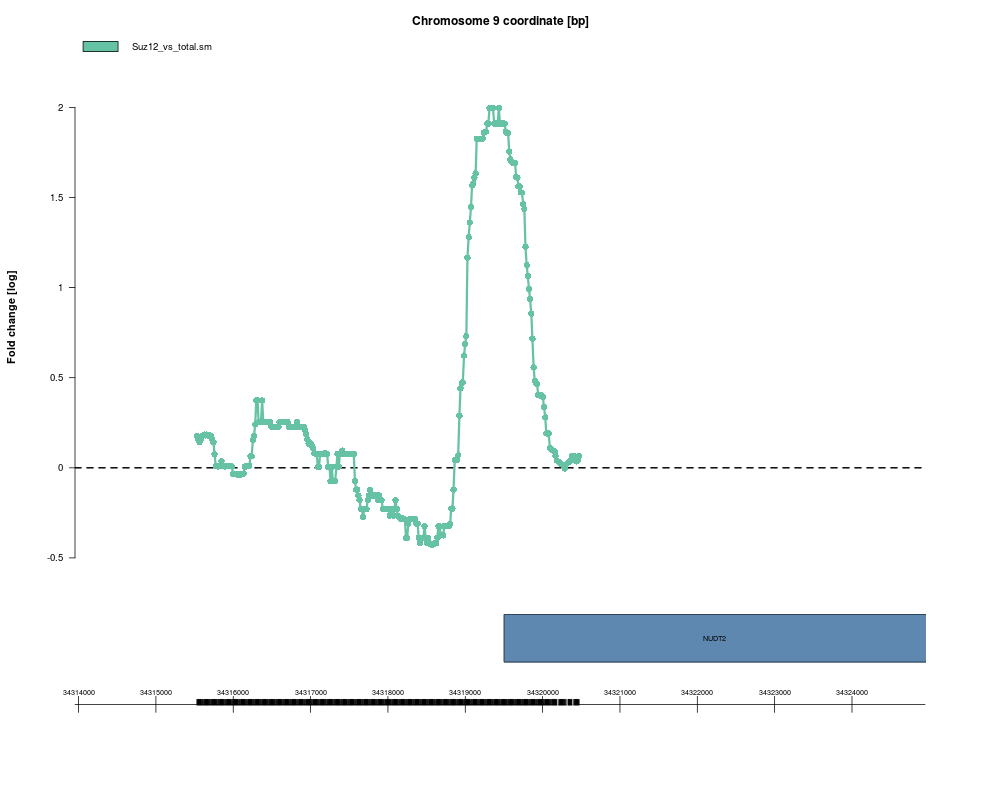
## plot a cher object
exDir <- system.file("exData",package="Ringo")
load(file.path(exDir,"exampleProbeAnno.rda"))
load(file.path(exDir,"exampleX.rda"))
smoothX <- computeRunningMedians(exampleX, probeAnno=exProbeAnno,
modColumn = "Cy5", allChr = "9", winHalfSize = 400)
plot(cherNudt2, smoothX, probeAnno=exProbeAnno, gff=exGFF, extent=5000)
Results
R version 3.3.1 (2016-06-21) -- "Bug in Your Hair"
Copyright (C) 2016 The R Foundation for Statistical Computing
Platform: x86_64-pc-linux-gnu (64-bit)

R is free software and comes with ABSOLUTELY NO WARRANTY.
You are welcome to redistribute it under certain conditions.
Type 'license()' or 'licence()' for distribution details.

R is a collaborative project with many contributors.
Type 'contributors()' for more information and
'citation()' on how to cite R or R packages in publications.

Type 'demo()' for some demos, 'help()' for on-line help, or
'help.start()' for an HTML browser interface to help.
Type 'q()' to quit R.

> library(Ringo)
Loading required package: Biobase
Loading required package: BiocGenerics
Loading required package: parallel

Attaching package: 'BiocGenerics'

The following objects are masked from 'package:parallel':

    clusterApply, clusterApplyLB, clusterCall, clusterEvalQ,
    clusterExport, clusterMap, parApply, parCapply, parLapply,
    parLapplyLB, parRapply, parSapply, parSapplyLB

The following objects are masked from 'package:stats':

    IQR, mad, xtabs

The following objects are masked from 'package:base':

    Filter, Find, Map, Position, Reduce, anyDuplicated, append,
    as.data.frame, cbind, colnames, do.call, duplicated, eval, evalq,
    get, grep, grepl, intersect, is.unsorted, lapply, lengths, mapply,
    match, mget, order, paste, pmax, pmax.int, pmin, pmin.int, rank,
    rbind, rownames, sapply, setdiff, sort, table, tapply, union,
    unique, unsplit

Welcome to Bioconductor

    Vignettes contain introductory material; view with
    'browseVignettes()'. To cite Bioconductor, see
    'citation("Biobase")', and for packages 'citation("pkgname")'.

Loading required package: RColorBrewer
Loading required package: limma

Attaching package: 'limma'

The following object is masked from 'package:BiocGenerics':

    plotMA

Loading required package: Matrix
Loading required package: grid
Loading required package: lattice
> png(filename="/home/ddbj/snapshot/RGM3/R_BC/result/Ringo/cherClass.Rd_%03d_medium.png", width=480, height=480)
> ### Name: cher-class
> ### Title: Class "cher" - ChIP-enriched region
> ### Aliases: cher-class initialize,cher-method show,cher-method
> ###   update,cher-method cher Cher cherList cherList-class chersToBED
> ###   cellType<-,cher,character-method cellType,cher-method cellType
> ###   cellType<- probes probes,cher-method probes,cherList-method
> ### Keywords: classes
>
> ### ** Examples
>
>   ## how to create a cher object from scratch
>   cherNudt2 <- new("cher", name="nudt2.cher", chromosome=9,
+                    start=34318954, end=34319944, antibody="Suz12",
+                    maxLevel=2.00, score=69.2, upSymbol="NUDT2")
>                    #extras=list(upSymbol="NUDT2"))
>   cherNudt2
nudt2.cher
Chr 9 : 34318954 - 34319944
Antibody : Suz12
Maximum level = 2
Score = 69.2
Defined extras: upSymbol
>   str(cherNudt2)
Formal class 'cher' [package "Ringo"] with 10 slots
  ..@ name      : chr "nudt2.cher"
  ..@ chromosome: chr "9"
  ..@ start     : int 34318954
  ..@ end       : int 34319944
  ..@ cellType  : chr NA
  ..@ antibody  : chr "Suz12"
  ..@ maxLevel  : num 2
  ..@ score     : num 69.2
  ..@ probes    : chr(0)
  ..@ extras    :List of 1
  .. ..$ upSymbol: chr "NUDT2"
>
>   ## use the update method (note:this update is biologically meaningless)
>   cher2 <- update(cherNudt2, cellType="HeLa", downSymbol="P53",
+                   probes=c("probe1","probe2"))
>   cher2; str(cher2)
nudt2.cher
Chr 9 : 34318954 - 34319944
Antibody : Suz12
Maximum level = 2
Score = 69.2
Spans 2 probes.
Defined extras: upSymbol, downSymbol
Formal class 'cher' [package "Ringo"] with 10 slots
  ..@ name      : chr "nudt2.cher"
  ..@ chromosome: chr "9"
  ..@ start     : int 34318954
  ..@ end       : int 34319944
  ..@ cellType  : chr "HeLa"
  ..@ antibody  : chr "Suz12"
  ..@ maxLevel  : num 2
  ..@ score     : num 69.2
  ..@ probes    : chr [1:2] "probe1" "probe2"
  ..@ extras    :List of 2
  .. ..$ upSymbol  : chr "NUDT2"
  .. ..$ downSymbol: chr "P53"
>
>   ## plot a cher object
>   exDir <- system.file("exData",package="Ringo")
>   load(file.path(exDir,"exampleProbeAnno.rda"))
>   load(file.path(exDir,"exampleX.rda"))
>   smoothX <- computeRunningMedians(exampleX, probeAnno=exProbeAnno,
+        modColumn = "Cy5", allChr = "9", winHalfSize = 400)

Chromosome 9 ...
Suz12_vs_total ...
Construction result ExpressionSet...Done.
>   plot(cherNudt2, smoothX, probeAnno=exProbeAnno, gff=exGFF, extent=5000)
>
>
>
>
>
> dev.off()
null device
          1
>
|