Supported by Dr. Osamu Ogasawara and  . . |
|
Last data update: 2014.03.03 |
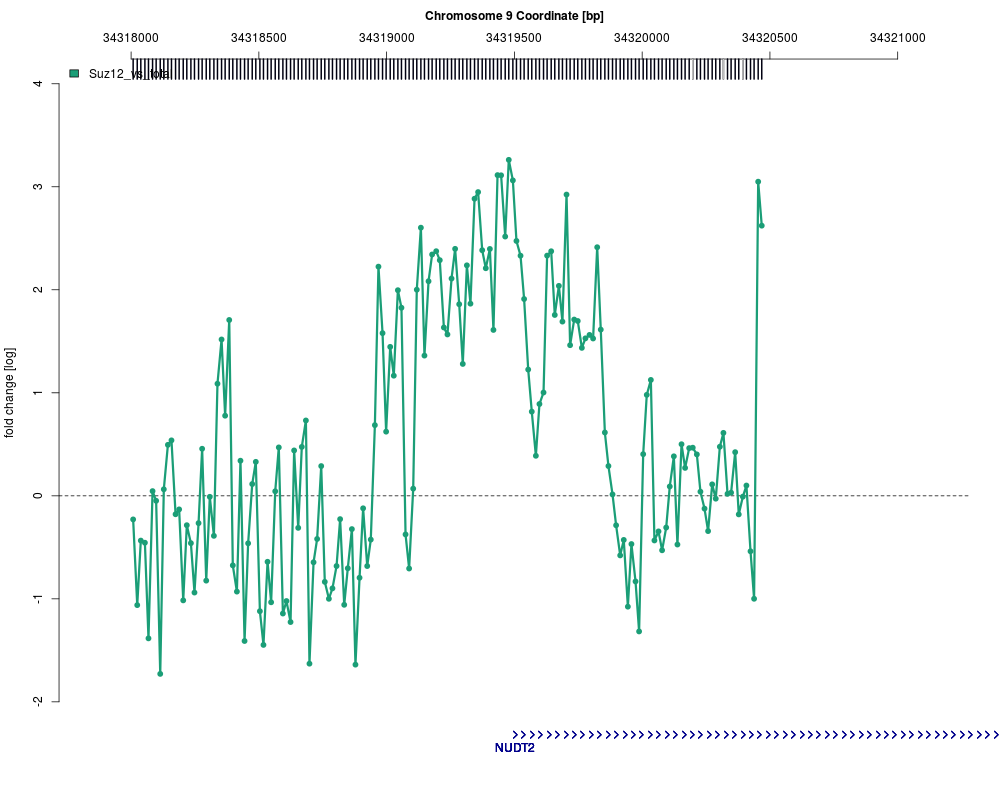
Visualize ChIP intensities along the chromosomeDescriptionThis function can visualize the array intensities from a ChIP chip
experiment for a chromosomal region or the whole chromosome. It's
loosely based on the UsagechipAlongChrom1(eSet, chrom, probeAnno, xlim, ylim = NULL, samples = NULL, paletteName = "Dark2", colPal = NULL, byStrand = FALSE, ylabel = "fold change [log]", rugCol = "#000010", itype = "r", ipch = 20, icex = 1, ilwd = 3, ilty = 1, useGFF = TRUE, gff = NULL, featCol = "darkblue", zero.line = TRUE, putLegend = TRUE, add = FALSE, maxInterDistance = 200, coord=NULL, verbose = TRUE, ...) Arguments
DetailsThe following The
Value
NoteUse the function Author(s)Joern Toedling See Also
Examples
  # load data
  ringoExampleDir <- system.file("exData",package="Ringo")
  load(file.path(ringoExampleDir,"exampleProbeAnno.rda"))
  load(file.path(ringoExampleDir,"exampleX.rda"))

  # show a gene that is well represented on this microarray
  chipAlongChrom1(exampleX, chrom="9", xlim=c(34318000,34321000),
                 ylim=c(-2,4), probeAnno=exProbeAnno, gff=exGFF)
Results
R version 3.3.1 (2016-06-21) -- "Bug in Your Hair"
Copyright (C) 2016 The R Foundation for Statistical Computing
Platform: x86_64-pc-linux-gnu (64-bit)

R is free software and comes with ABSOLUTELY NO WARRANTY.
You are welcome to redistribute it under certain conditions.
Type 'license()' or 'licence()' for distribution details.

R is a collaborative project with many contributors.
Type 'contributors()' for more information and
'citation()' on how to cite R or R packages in publications.

Type 'demo()' for some demos, 'help()' for on-line help, or
'help.start()' for an HTML browser interface to help.
Type 'q()' to quit R.

> library(Ringo)
Loading required package: Biobase
Loading required package: BiocGenerics
Loading required package: parallel

Attaching package: 'BiocGenerics'

The following objects are masked from 'package:parallel':

    clusterApply, clusterApplyLB, clusterCall, clusterEvalQ,
    clusterExport, clusterMap, parApply, parCapply, parLapply,
    parLapplyLB, parRapply, parSapply, parSapplyLB

The following objects are masked from 'package:stats':

    IQR, mad, xtabs

The following objects are masked from 'package:base':

    Filter, Find, Map, Position, Reduce, anyDuplicated, append,
    as.data.frame, cbind, colnames, do.call, duplicated, eval, evalq,
    get, grep, grepl, intersect, is.unsorted, lapply, lengths, mapply,
    match, mget, order, paste, pmax, pmax.int, pmin, pmin.int, rank,
    rbind, rownames, sapply, setdiff, sort, table, tapply, union,
    unique, unsplit

Welcome to Bioconductor

    Vignettes contain introductory material; view with
    'browseVignettes()'. To cite Bioconductor, see
    'citation("Biobase")', and for packages 'citation("pkgname")'.

Loading required package: RColorBrewer
Loading required package: limma

Attaching package: 'limma'

The following object is masked from 'package:BiocGenerics':

    plotMA

Loading required package: Matrix
Loading required package: grid
Loading required package: lattice
> png(filename="/home/ddbj/snapshot/RGM3/R_BC/result/Ringo/chipAlongChromOld.Rd_%03d_medium.png", width=480, height=480)
> ### Name: chipAlongChrom1
> ### Title: Visualize ChIP intensities along the chromosome
> ### Aliases: chipAlongChrom1 chipAlongChromOld
> ### Keywords: internal hplot
>
> ### ** Examples
>
>   # load data
>   ringoExampleDir <- system.file("exData",package="Ringo")
>   load(file.path(ringoExampleDir,"exampleProbeAnno.rda"))
>   load(file.path(ringoExampleDir,"exampleX.rda"))
>
>   # show a gene that is well represented on this microarray
>   chipAlongChrom1(exampleX, chrom="9", xlim=c(34318000,34321000),
+                  ylim=c(-2,4), probeAnno=exProbeAnno, gff=exGFF)
Getting probe intensities in selected regions..,
Preparing color scheme...
Plotting intensities...
Obtain genomic features...
>
>
>
>
>
> dev.off()
null device
          1
>
|