Supported by Dr. Osamu Ogasawara and  . . |
|
Last data update: 2014.03.03 |
Function to compute sliding T statistics on a tiling expression setDescriptionFunction to compute sliding (regularized) one- or two-sample T statistics on a tiling expression set. UsagecomputeSlidingT(xSet, probeAnno, allChr = c(1:19, "X", "Y"), test = "one.sample", grouping = NULL, winHalfSize = 400, min.probes = 5, checkUnique = TRUE, uniqueCodes = c(0), verbose = TRUE) Arguments
ValueAn object of class Author(s)Joern Toedling See Also
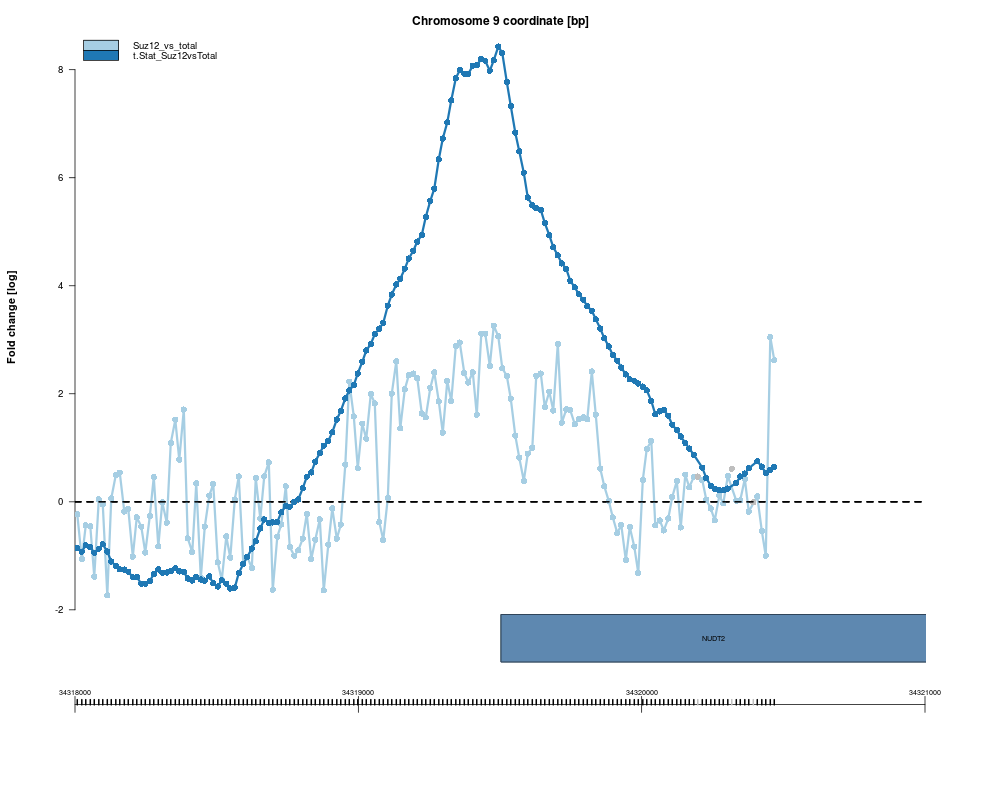
Examples
 exDir <- system.file("exData",package="Ringo")
  load(file.path(exDir,"exampleProbeAnno.rda"))
  load(file.path(exDir,"exampleX.rda"))
  tX <- computeSlidingT(exampleX, probeAnno=exProbeAnno,
             allChr=c("9"), winHalfSize=400)
  sampleNames(tX) <- "t-Stat_Suz12vsTotal"
  if (interactive()){
    grid.newpage()
    plot(cbind2(exampleX, tX), exProbeAnno, chrom="9",
         xlim=c(34318000,34321000), ylim=c(-2,8.5), gff=exGFF,
         paletteName="Paired")
  }
Results
R version 3.3.1 (2016-06-21) -- "Bug in Your Hair"
Copyright (C) 2016 The R Foundation for Statistical Computing
Platform: x86_64-pc-linux-gnu (64-bit)

R is free software and comes with ABSOLUTELY NO WARRANTY.
You are welcome to redistribute it under certain conditions.
Type 'license()' or 'licence()' for distribution details.

R is a collaborative project with many contributors.
Type 'contributors()' for more information and
'citation()' on how to cite R or R packages in publications.

Type 'demo()' for some demos, 'help()' for on-line help, or
'help.start()' for an HTML browser interface to help.
Type 'q()' to quit R.

> library(Ringo)
Loading required package: Biobase
Loading required package: BiocGenerics
Loading required package: parallel

Attaching package: 'BiocGenerics'

The following objects are masked from 'package:parallel':

    clusterApply, clusterApplyLB, clusterCall, clusterEvalQ,
    clusterExport, clusterMap, parApply, parCapply, parLapply,
    parLapplyLB, parRapply, parSapply, parSapplyLB

The following objects are masked from 'package:stats':

    IQR, mad, xtabs

The following objects are masked from 'package:base':

    Filter, Find, Map, Position, Reduce, anyDuplicated, append,
    as.data.frame, cbind, colnames, do.call, duplicated, eval, evalq,
    get, grep, grepl, intersect, is.unsorted, lapply, lengths, mapply,
    match, mget, order, paste, pmax, pmax.int, pmin, pmin.int, rank,
    rbind, rownames, sapply, setdiff, sort, table, tapply, union,
    unique, unsplit

Welcome to Bioconductor

    Vignettes contain introductory material; view with
    'browseVignettes()'. To cite Bioconductor, see
    'citation("Biobase")', and for packages 'citation("pkgname")'.

Loading required package: RColorBrewer
Loading required package: limma

Attaching package: 'limma'

The following object is masked from 'package:BiocGenerics':

    plotMA

Loading required package: Matrix
Loading required package: grid
Loading required package: lattice
> png(filename="/home/ddbj/snapshot/RGM3/R_BC/result/Ringo/compute_sliding_t.Rd_%03d_medium.png", width=480, height=480)
> ### Name: computeSlidingT
> ### Title: Function to compute sliding T statistics on a tiling expression
> ###   set
> ### Aliases: computeSlidingT
> ### Keywords: manip
>
> ### ** Examples
>
>  exDir <- system.file("exData",package="Ringo")
>   load(file.path(exDir,"exampleProbeAnno.rda"))
>   load(file.path(exDir,"exampleX.rda"))
>   tX <- computeSlidingT(exampleX, probeAnno=exProbeAnno,
+              allChr=c("9"), winHalfSize=400)

 computing probe-wise mean and standard deviation in sliding window.
 chr9  Suz12_vs_total ...
 computing t-statistics...
preparing result...done.
>   sampleNames(tX) <- "t-Stat_Suz12vsTotal"
> #  if (interactive()){
>     grid.newpage()
>     plot(cbind2(exampleX, tX), exProbeAnno, chrom="9",
+          xlim=c(34318000,34321000), ylim=c(-2,8.5), gff=exGFF,
+          paletteName="Paired")
> #  }
>
>
>
>
>
> dev.off()
null device
          1
>
|