Supported by Dr. Osamu Ogasawara and  . . |
|
Last data update: 2014.03.03 |
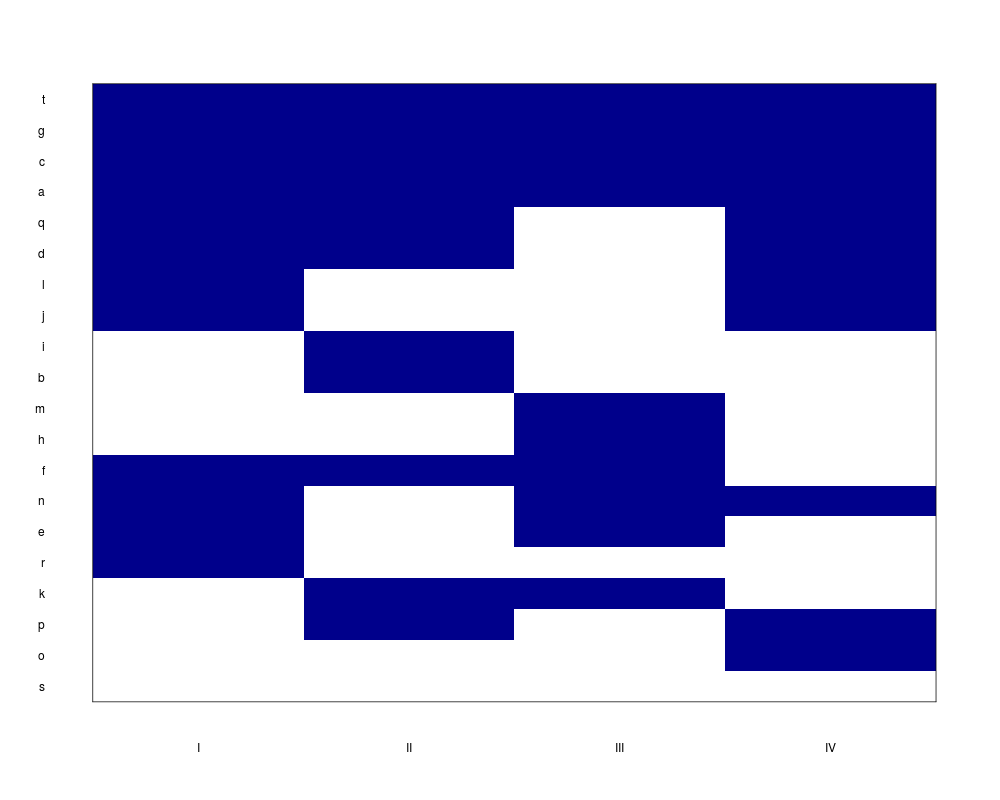
Visualization of a binary matrixDescriptionThis function produces simple, heatmap-like visualizations of binary matrices. UsageplotBM(x, boxCol = "darkblue", reorder = FALSE, frame = TRUE, ...) Arguments
DetailsFor reordering, each row is interpreted as a binary matrix, for example a row z=(1,0,0,1) would be interpreted as the binary number 1001 = 9 in the decimal system. Rows are then reordered by the frequency of each binary number with the rows that correspond to the most frequent binary number shown at the top in the visualization. ValueThe function invisibly returns the (reordered)
matrix NoteAn alternative way to display such matrices are given by
Author(s)Joern Toedling See Also
Examples
  A <- matrix(round(runif(80)), ncol=4, byrow=TRUE)
  dimnames(A)=list(letters[seq(nrow(A))],
                   as.character(as.roman(seq(ncol(A)))))
  show(A)
  plotBM(A, reorder=FALSE)
  plotBM(A, reorder=TRUE)
Results
R version 3.3.1 (2016-06-21) -- "Bug in Your Hair"
Copyright (C) 2016 The R Foundation for Statistical Computing
Platform: x86_64-pc-linux-gnu (64-bit)

R is free software and comes with ABSOLUTELY NO WARRANTY.
You are welcome to redistribute it under certain conditions.
Type 'license()' or 'licence()' for distribution details.

R is a collaborative project with many contributors.
Type 'contributors()' for more information and
'citation()' on how to cite R or R packages in publications.

Type 'demo()' for some demos, 'help()' for on-line help, or
'help.start()' for an HTML browser interface to help.
Type 'q()' to quit R.

> library(Ringo)
Loading required package: Biobase
Loading required package: BiocGenerics
Loading required package: parallel

Attaching package: 'BiocGenerics'

The following objects are masked from 'package:parallel':

    clusterApply, clusterApplyLB, clusterCall, clusterEvalQ,
    clusterExport, clusterMap, parApply, parCapply, parLapply,
    parLapplyLB, parRapply, parSapply, parSapplyLB

The following objects are masked from 'package:stats':

    IQR, mad, xtabs

The following objects are masked from 'package:base':

    Filter, Find, Map, Position, Reduce, anyDuplicated, append,
    as.data.frame, cbind, colnames, do.call, duplicated, eval, evalq,
    get, grep, grepl, intersect, is.unsorted, lapply, lengths, mapply,
    match, mget, order, paste, pmax, pmax.int, pmin, pmin.int, rank,
    rbind, rownames, sapply, setdiff, sort, table, tapply, union,
    unique, unsplit

Welcome to Bioconductor

    Vignettes contain introductory material; view with
    'browseVignettes()'. To cite Bioconductor, see
    'citation("Biobase")', and for packages 'citation("pkgname")'.

Loading required package: RColorBrewer
Loading required package: limma

Attaching package: 'limma'

The following object is masked from 'package:BiocGenerics':

    plotMA

Loading required package: Matrix
Loading required package: grid
Loading required package: lattice
> png(filename="/home/ddbj/snapshot/RGM3/R_BC/result/Ringo/plotBM.Rd_%03d_medium.png", width=480, height=480)
> ### Name: plotBM
> ### Title: Visualization of a binary matrix
> ### Aliases: plotBM plotBinaryMatrix
> ### Keywords: hplot
>
> ### ** Examples
>
>   A <- matrix(round(runif(80)), ncol=4, byrow=TRUE)
>   dimnames(A)=list(letters[seq(nrow(A))],
+                    as.character(as.roman(seq(ncol(A)))))
>   show(A)
  I II III IV
a 1  1   0  0
b 0  1   1  0
c 1  0   1  0
d 1  1   0  1
e 1  1   0  1
f 0  1   1  0
g 0  0   0  0
h 1  1   1  1
i 1  0   1  1
j 0  1   1  1
k 1  1   0  0
l 0  0   1  0
m 0  1   1  1
n 0  1   0  0
o 1  1   0  0
p 1  0   1  0
q 0  1   1  0
r 0  0   1  0
s 1  1   1  0
t 0  0   0  0
>   plotBM(A, reorder=FALSE)
>   plotBM(A, reorder=TRUE)
>
>
>
>
>
> dev.off()
null device
          1
>
|