Supported by Dr. Osamu Ogasawara and  . . |
|
Last data update: 2014.03.03 |
Compute quantile of scores in a sliding windowDescriptionThis functions is used to slide a window of specified size over scores at given positions. Computed is the quantile over the scores in the window. Usage
sliding.quantile(positions, scores, half.width, prob = 0.5,
                 return.counts = TRUE)
Arguments
ValueMatrix with two columns:
These positions are given as Author(s)Oleg Sklyar and Joern Toedling See Also
Examples
sampleSize <- 1000
ap <- cumsum(1+round(runif(sampleSize)*10))
as <- c(rnorm(floor(sampleSize/3)),
rnorm(ceiling(sampleSize/3),mean=1.5),
rnorm(floor(sampleSize/3)))
arm <- sliding.quantile(ap, as, 20)
arq <- sliding.quantile(ap, as, 20, prob=0.25)
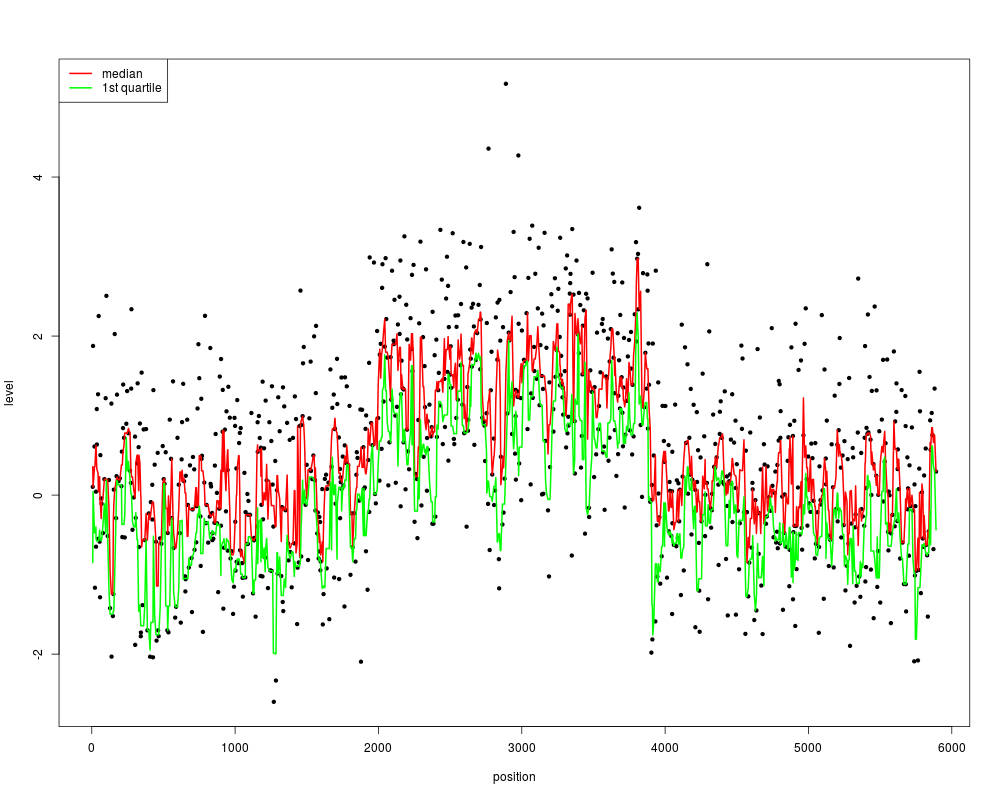
plot(ap, as, pch=20, xlab="position",ylab="level")
points(ap, arm[,1], type="l", col="red", lwd=2)
points(ap, arq[,1], type="l", col="green", lwd=2)
legend(x="topleft", legend=c("median","1st quartile"),
col=c("red","green"), lty=1, lwd=2)
Results
R version 3.3.1 (2016-06-21) -- "Bug in Your Hair"
Copyright (C) 2016 The R Foundation for Statistical Computing
Platform: x86_64-pc-linux-gnu (64-bit)

R is free software and comes with ABSOLUTELY NO WARRANTY.
You are welcome to redistribute it under certain conditions.
Type 'license()' or 'licence()' for distribution details.

R is a collaborative project with many contributors.
Type 'contributors()' for more information and
'citation()' on how to cite R or R packages in publications.

Type 'demo()' for some demos, 'help()' for on-line help, or
'help.start()' for an HTML browser interface to help.
Type 'q()' to quit R.

> library(Ringo)
Loading required package: Biobase
Loading required package: BiocGenerics
Loading required package: parallel

Attaching package: 'BiocGenerics'

The following objects are masked from 'package:parallel':

    clusterApply, clusterApplyLB, clusterCall, clusterEvalQ,
    clusterExport, clusterMap, parApply, parCapply, parLapply,
    parLapplyLB, parRapply, parSapply, parSapplyLB

The following objects are masked from 'package:stats':

    IQR, mad, xtabs

The following objects are masked from 'package:base':

    Filter, Find, Map, Position, Reduce, anyDuplicated, append,
    as.data.frame, cbind, colnames, do.call, duplicated, eval, evalq,
    get, grep, grepl, intersect, is.unsorted, lapply, lengths, mapply,
    match, mget, order, paste, pmax, pmax.int, pmin, pmin.int, rank,
    rbind, rownames, sapply, setdiff, sort, table, tapply, union,
    unique, unsplit

Welcome to Bioconductor

    Vignettes contain introductory material; view with
    'browseVignettes()'. To cite Bioconductor, see
    'citation("Biobase")', and for packages 'citation("pkgname")'.

Loading required package: RColorBrewer
Loading required package: limma

Attaching package: 'limma'

The following object is masked from 'package:BiocGenerics':

    plotMA

Loading required package: Matrix
Loading required package: grid
Loading required package: lattice
> png(filename="/home/ddbj/snapshot/RGM3/R_BC/result/Ringo/sliding_quantile.Rd_%03d_medium.png", width=480, height=480)
> ### Name: sliding.quantile
> ### Title: Compute quantile of scores in a sliding window
> ### Aliases: sliding.quantile slidingquantile
> ### Keywords: manip
>
> ### ** Examples
>
>   sampleSize <- 1000
>   ap <- cumsum(1+round(runif(sampleSize)*10))
>   as <- c(rnorm(floor(sampleSize/3)),
+           rnorm(ceiling(sampleSize/3),mean=1.5),
+           rnorm(floor(sampleSize/3)))
>   arm <- sliding.quantile(ap, as, 20)
>   arq <- sliding.quantile(ap, as, 20, prob=0.25)
>   plot(ap, as, pch=20, xlab="position",ylab="level")
>   points(ap, arm[,1], type="l", col="red", lwd=2)
>   points(ap, arq[,1], type="l", col="green", lwd=2)
>   legend(x="topleft", legend=c("median","1st quartile"),
+          col=c("red","green"), lty=1, lwd=2)
>
>
>
>
>
> dev.off()
null device
          1
>
|