Supported by Dr. Osamu Ogasawara and  . . |
|
Last data update: 2014.03.03 |
PLINK method of moment (MoM) for the Identity-By-Descent (IBD) AnalysisDescriptionCalculate three IBD coefficients for non-inbred individual pairs by PLINK method of moment (MoM). Usage
snpgdsIBDMoM(gdsobj, sample.id=NULL, snp.id=NULL, autosome.only=TRUE,
    remove.monosnp=TRUE, maf=NaN, missing.rate=NaN, allele.freq=NULL,
    kinship=FALSE, kinship.constraint=FALSE, num.thread=1, verbose=TRUE)
Arguments
DetailsPLINK IBD estimator is a moment estimator, and it is computationally efficient relative to MLE method. In the PLINK method of moment, a correction factor based on allele counts is used to adjust for sampling. However, if allele frequencies are specified, no correction factor is conducted since the specified allele frequencies are assumed to be known without sampling. The minor allele frequency and missing rate for each SNP passed in
ValueReturn a list:
Author(s)Xiuwen Zheng ReferencesPurcell S, Neale B, Todd-Brown K, Thomas L, Ferreira MAR, Bender D, Maller J, Sklar P, de Bakker PIW, Daly MJ & Sham PC. 2007. PLINK: a toolset for whole-genome association and population-based linkage analysis. American Journal of Human Genetics, 81. See Also
Examples
# open an example dataset (HapMap)
genofile <- snpgdsOpen(snpgdsExampleFileName())

#########################################################
# CEU population

CEU.id <- read.gdsn(index.gdsn(genofile, "sample.id"))[
    read.gdsn(index.gdsn(genofile, "sample.annot/pop.group"))=="CEU"]
pibd <- snpgdsIBDMoM(genofile, sample.id=CEU.id)
names(pibd)

flag <- lower.tri(pibd$k0)
plot(NaN, xlim=c(0,1), ylim=c(0,1), xlab="k0", ylab="k1")
lines(c(0,1), c(1,0), col="red", lty=3)
points(pibd$k0[flag], pibd$k1[flag])

# select a set of pairs of individuals
d <- snpgdsIBDSelection(pibd, kinship.cutoff=1/8)
head(d)


#########################################################
# YRI population

YRI.id <- read.gdsn(index.gdsn(genofile, "sample.id"))[
    read.gdsn(index.gdsn(genofile, "sample.annot/pop.group"))=="YRI"]
pibd <- snpgdsIBDMoM(genofile, sample.id=YRI.id)
flag <- lower.tri(pibd$k0)
plot(NaN, xlim=c(0,1), ylim=c(0,1), xlab="k0", ylab="k1")
lines(c(0,1), c(1,0), col="red", lty=3)
points(pibd$k0[flag], pibd$k1[flag])


# specify the allele frequencies
afreq <- snpgdsSNPRateFreq(genofile, sample.id=YRI.id)$AlleleFreq
aibd <- snpgdsIBDMoM(genofile, sample.id=YRI.id, allele.freq=afreq)
flag <- lower.tri(aibd$k0)
plot(NaN, xlim=c(0,1), ylim=c(0,1), xlab="k0", ylab="k1")
lines(c(0,1), c(1,0), col="red", lty=3)
points(aibd$k0[flag], aibd$k1[flag])

# analysis on a subset
subibd <- snpgdsIBDMoM(genofile, sample.id=YRI.id[1:25], allele.freq=afreq)
summary(c(subibd$k0 - aibd$k0[1:25, 1:25]))
# ZERO
summary(c(subibd$k1 - aibd$k1[1:25, 1:25]))
# ZERO


# close the genotype file
snpgdsClose(genofile)
Results
R version 3.3.1 (2016-06-21) -- "Bug in Your Hair"
Copyright (C) 2016 The R Foundation for Statistical Computing
Platform: x86_64-pc-linux-gnu (64-bit)
R is free software and comes with ABSOLUTELY NO WARRANTY.
You are welcome to redistribute it under certain conditions.
Type 'license()' or 'licence()' for distribution details.
R is a collaborative project with many contributors.
Type 'contributors()' for more information and
'citation()' on how to cite R or R packages in publications.
Type 'demo()' for some demos, 'help()' for on-line help, or
'help.start()' for an HTML browser interface to help.
Type 'q()' to quit R.
> library(SNPRelate)
Loading required package: gdsfmt
SNPRelate -- supported by Streaming SIMD Extensions 2 (SSE2)
> png(filename="/home/ddbj/snapshot/RGM3/R_BC/result/SNPRelate/snpgdsIBDMoM.Rd_%03d_medium.png", width=480, height=480)
> ### Name: snpgdsIBDMoM
> ### Title: PLINK method of moment (MoM) for the Identity-By-Descent (IBD)
> ### Analysis
> ### Aliases: snpgdsIBDMoM
> ### Keywords: GDS GWAS
>
> ### ** Examples
>
> # open an example dataset (HapMap)
> genofile <- snpgdsOpen(snpgdsExampleFileName())
>
> #########################################################
> # CEU population
>
> CEU.id <- read.gdsn(index.gdsn(genofile, "sample.id"))[
+ read.gdsn(index.gdsn(genofile, "sample.annot/pop.group"))=="CEU"]
> pibd <- snpgdsIBDMoM(genofile, sample.id=CEU.id)
IBD analysis (PLINK method of moment) on SNP genotypes:
Excluding 365 SNPs on non-autosomes
Excluding 1217 SNPs (monomorphic: TRUE, < MAF: NaN, or > missing rate: NaN)
Working space: 92 samples, 7506 SNPs
using 1 (CPU) core
PLINK IBD: the sum of all selected genotypes (0, 1 and 2) = 702139
Wed Jul 6 05:34:43 2016 (internal increment: 65536)
[>.................................................] 0%, ETC: NA [==================================================] 100%, completed
Wed Jul 6 05:34:43 2016 Done.
> names(pibd)
[1] "sample.id" "snp.id" "afreq" "k0" "k1"
>
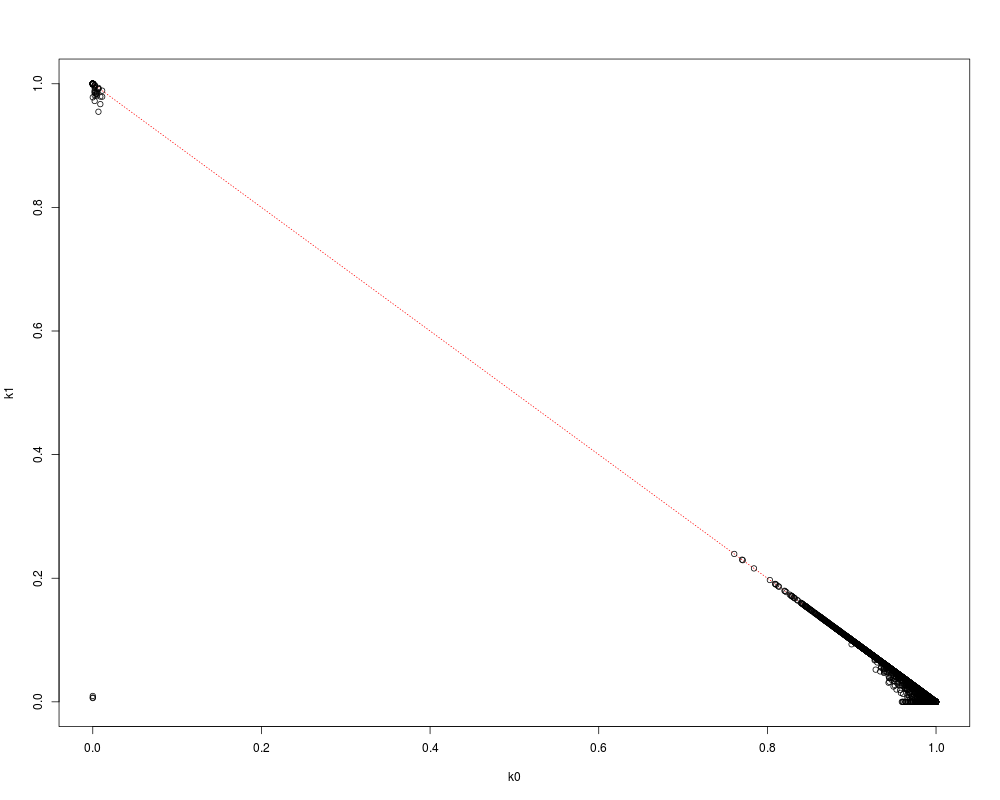
> flag <- lower.tri(pibd$k0)
> plot(NaN, xlim=c(0,1), ylim=c(0,1), xlab="k0", ylab="k1")
> lines(c(0,1), c(1,0), col="red", lty=3)
> points(pibd$k0[flag], pibd$k1[flag])
>
> # select a set of pairs of individuals
> d <- snpgdsIBDSelection(pibd, kinship.cutoff=1/8)
> head(d)
ID1 ID2 k0 k1 kinship
1 NA07034 NA07048 0.000000000 1.0000000 0.2500000
2 NA07055 NA07048 0.000000000 0.9780063 0.2554984
3 NA12814 NA12802 0.004482185 0.9808720 0.2525409
4 NA10847 NA12239 0.000000000 1.0000000 0.2500000
5 NA10847 NA12146 0.000000000 1.0000000 0.2500000
6 NA12056 NA10851 0.002237194 0.9935560 0.2504924
>
>
> #########################################################
> # YRI population
>
> YRI.id <- read.gdsn(index.gdsn(genofile, "sample.id"))[
+ read.gdsn(index.gdsn(genofile, "sample.annot/pop.group"))=="YRI"]
> pibd <- snpgdsIBDMoM(genofile, sample.id=YRI.id)
IBD analysis (PLINK method of moment) on SNP genotypes:
Excluding 365 SNPs on non-autosomes
Excluding 563 SNPs (monomorphic: TRUE, < MAF: NaN, or > missing rate: NaN)
Working space: 93 samples, 8160 SNPs
using 1 (CPU) core
PLINK IBD: the sum of all selected genotypes (0, 1 and 2) = 755648
Wed Jul 6 05:34:43 2016 (internal increment: 65536)
[>.................................................] 0%, ETC: NA [==================================================] 100%, completed
Wed Jul 6 05:34:44 2016 Done.
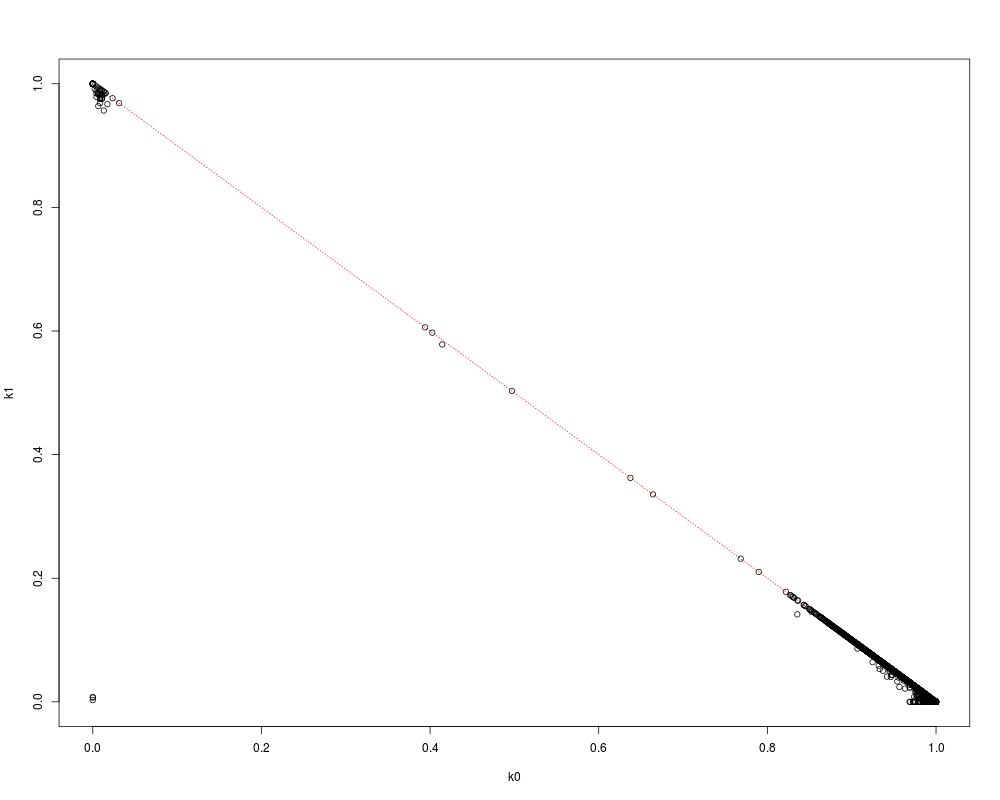
> flag <- lower.tri(pibd$k0)
> plot(NaN, xlim=c(0,1), ylim=c(0,1), xlab="k0", ylab="k1")
> lines(c(0,1), c(1,0), col="red", lty=3)
> points(pibd$k0[flag], pibd$k1[flag])
>
>
> # specify the allele frequencies
> afreq <- snpgdsSNPRateFreq(genofile, sample.id=YRI.id)$AlleleFreq
> aibd <- snpgdsIBDMoM(genofile, sample.id=YRI.id, allele.freq=afreq)
IBD analysis (PLINK method of moment) on SNP genotypes:
Excluding 365 SNPs on non-autosomes
Excluding 563 SNPs (monomorphic: TRUE, < MAF: NaN, or > missing rate: NaN)
Working space: 93 samples, 8160 SNPs
using 1 (CPU) core
Specifying allele frequencies, mean: 0.500, sd: 0.315
*** A correction factor based on allele count is not used, since the allele frequencies are specified.
PLINK IBD: the sum of all selected genotypes (0, 1 and 2) = 755648
Wed Jul 6 05:34:44 2016 (internal increment: 65536)
[>.................................................] 0%, ETC: NA [==================================================] 100%, completed
Wed Jul 6 05:34:44 2016 Done.
> flag <- lower.tri(aibd$k0)
> plot(NaN, xlim=c(0,1), ylim=c(0,1), xlab="k0", ylab="k1")
> lines(c(0,1), c(1,0), col="red", lty=3)
> points(aibd$k0[flag], aibd$k1[flag])
>
> # analysis on a subset
> subibd <- snpgdsIBDMoM(genofile, sample.id=YRI.id[1:25], allele.freq=afreq)
IBD analysis (PLINK method of moment) on SNP genotypes:
Excluding 365 SNPs on non-autosomes
Excluding 563 SNPs (monomorphic: TRUE, < MAF: NaN, or > missing rate: NaN)
Working space: 25 samples, 8160 SNPs
using 1 (CPU) core
Specifying allele frequencies, mean: 0.500, sd: 0.315
*** A correction factor based on allele count is not used, since the allele frequencies are specified.
PLINK IBD: the sum of all selected genotypes (0, 1 and 2) = 203285
Wed Jul 6 05:34:44 2016 (internal increment: 65536)
[>.................................................] 0%, ETC: NA [==================================================] 100%, completed
Wed Jul 6 05:34:44 2016 Done.
> summary(c(subibd$k0 - aibd$k0[1:25, 1:25]))
Min. 1st Qu. Median Mean 3rd Qu. Max.
0 0 0 0 0 0
> # ZERO
> summary(c(subibd$k1 - aibd$k1[1:25, 1:25]))
Min. 1st Qu. Median Mean 3rd Qu. Max.
0 0 0 0 0 0
> # ZERO
>
>
> # close the genotype file
> snpgdsClose(genofile)
>
>
>
>
>
> dev.off()
null device
1
>
|