R version 3.3.1 (2016-06-21) -- "Bug in Your Hair"
Copyright (C) 2016 The R Foundation for Statistical Computing
Platform: x86_64-pc-linux-gnu (64-bit)
R is free software and comes with ABSOLUTELY NO WARRANTY.
You are welcome to redistribute it under certain conditions.
Type 'license()' or 'licence()' for distribution details.
R is a collaborative project with many contributors.
Type 'contributors()' for more information and
'citation()' on how to cite R or R packages in publications.
Type 'demo()' for some demos, 'help()' for on-line help, or
'help.start()' for an HTML browser interface to help.
Type 'q()' to quit R.
> library(SNPchip)
Welcome to SNPchip version 2.18.0
> png(filename="/home/ddbj/snapshot/RGM3/R_BC/result/SNPchip/plotIdiogram.Rd_%03d_medium.png", width=480, height=480)
> ### Name: plotIdiogram
> ### Title: Plots idiogram for one chromosome
> ### Aliases: plotIdiogram plotCytoband2
> ### Keywords: aplot
>
> ### ** Examples
>
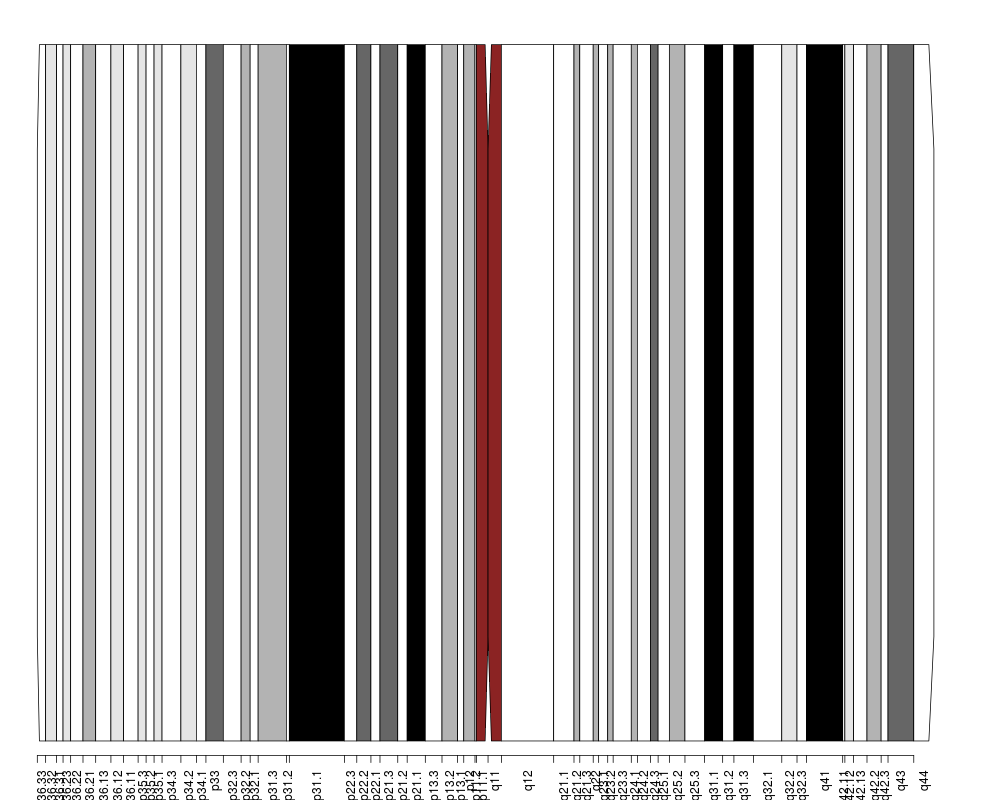
> plotIdiogram("1", "hg18")
NULL
> plotIdiogram("1", "hg19")
NULL
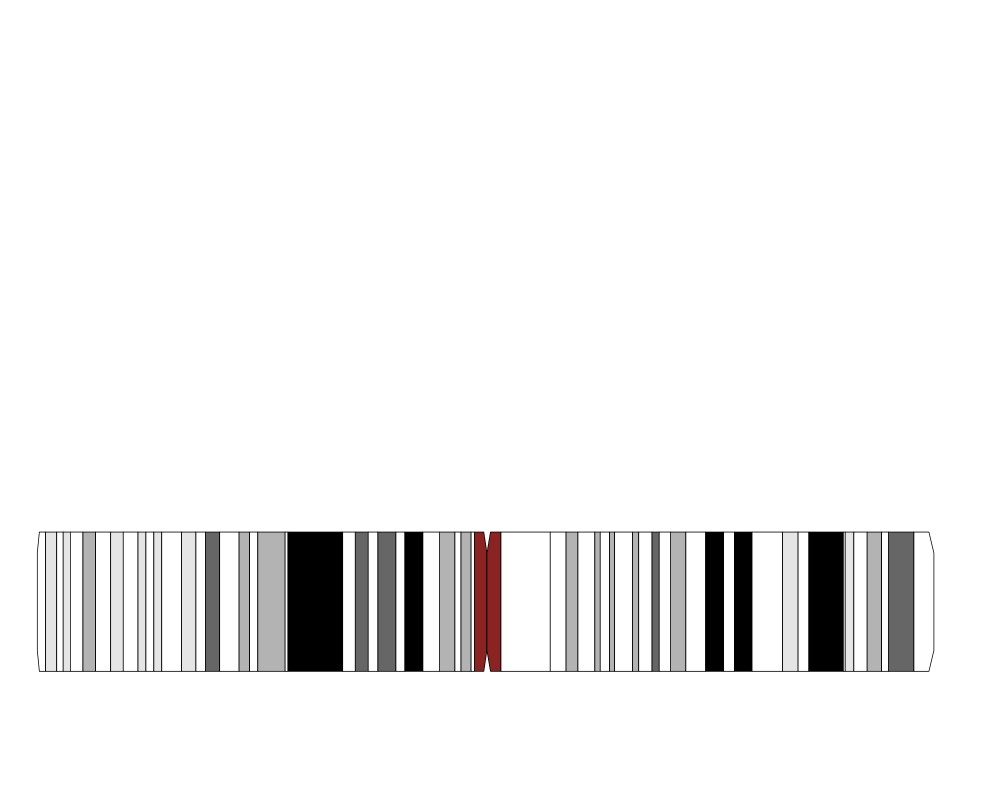
> plotIdiogram("1", build="hg19", cex=0.8, label.cytoband=FALSE)
NULL
> ## user-defined coordinates
> plotIdiogram("1", build="hg19", cex=0.8, label.cytoband=FALSE,
+ ylim=c(0,1), cytoband.ycoords=c(0.1, 0.3))
NULL
>
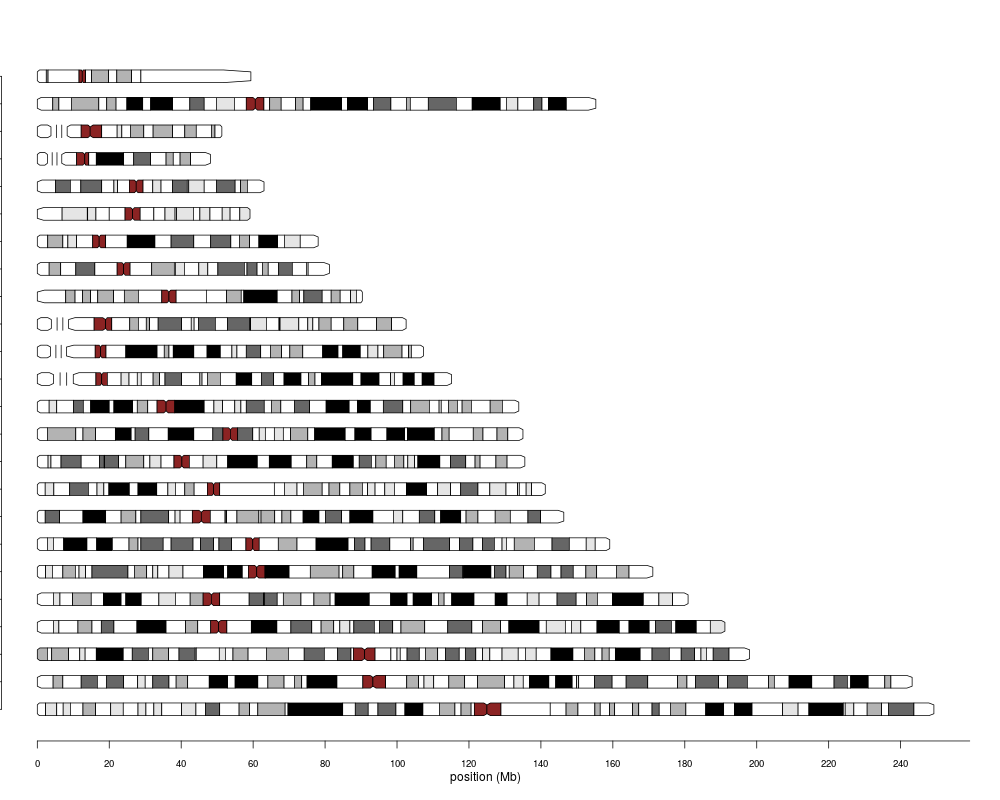
> library(oligoClasses)
Welcome to oligoClasses version 1.34.0
> sl <- getSequenceLengths("hg19")[c(paste("chr", 1:22, sep=""), "chrX", "chrY")]
> ybottom <- seq(0, 1, length.out=length(sl)) - 0.01
> ytop <- seq(0, 1, length.out=length(sl)) + 0.01
> for(i in seq_along(sl)){
+ chr <- names(sl)[i]
+ if(i == 1){
+ plotIdiogram("1", build="hg19", cex=0.8, label.cytoband=FALSE, ylim=c(-0.05,1.05), cytoband.ycoords=c(ybottom[1], ytop[1]),
+ xlim=c(0, max(sl)))
+ }
+ if(i > 1){
+ plotIdiogram(names(sl)[i], build="hg19", cex=0.8, label.cytoband=FALSE, cytoband.ycoords=c(ybottom[i], ytop[i]), new=FALSE)
+ }
+ }
> axis(1, at=pretty(c(0, max(sl)), n=10), labels=pretty(c(0, max(sl)), n=10)/1e6, cex.axis=0.8)
> mtext("position (Mb)", 1, line=2)
> par(las=1)
> axis(2, at=ybottom+0.01, names(sl), cex.axis=0.6)
>
>
>
>
>
> dev.off()
null device
1
>
 .
.