Supported by Dr. Osamu Ogasawara and  . . |
|
Last data update: 2014.03.03 |
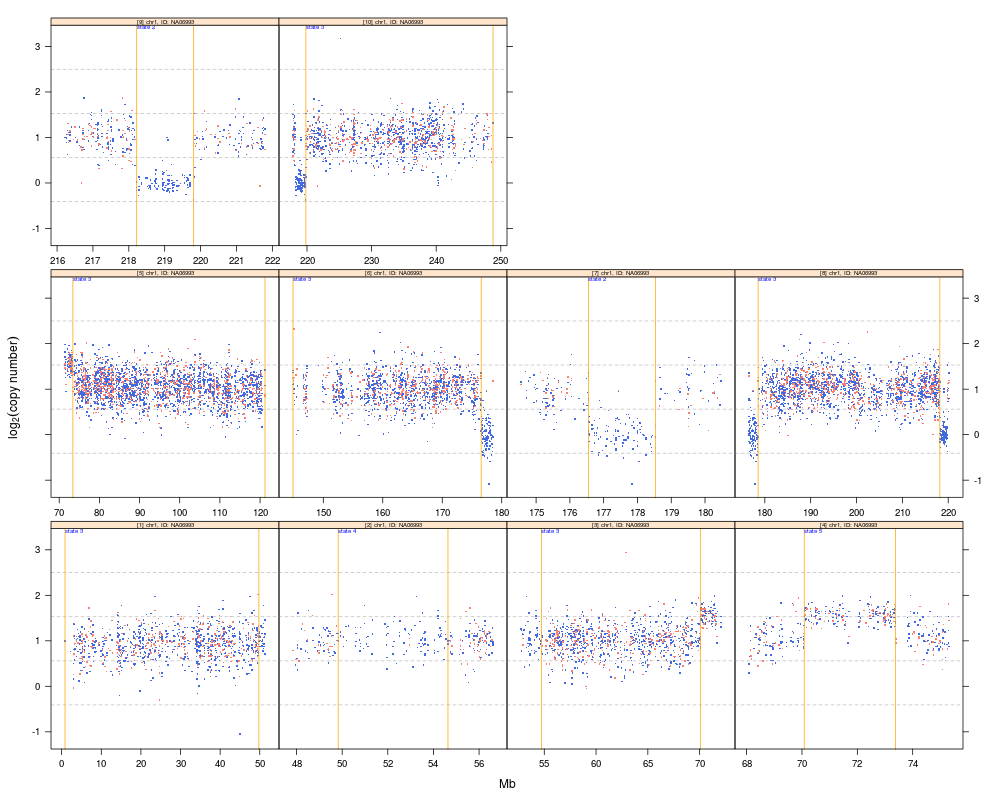
Plot copy number and physical position for a set of genomic intervals.DescriptionPlot copy number and physical position given by a
Usagexyplot2(x, data, range, frame=50e3L, ...) Arguments
DetailsThese functions plot copy number estimates versus physical
position. The function is particularly useful for multi-panel displays
in which the copy number estimates for a single range of a
ValueAn object of class Author(s)R. Scharpf See Also
To modify the plot appearance from the default, additional arguments
can be passed to Examples
  ## simulated data
  library(oligoClasses)
  library(IRanges)
  library(VanillaICE)
  data(oligoSetExample, package="oligoClasses")
  ## The oligoSnpSet class will likely be deprecated and made defunct
  ## in a future release.  Instead, we favor
  ## RangedSummarizedExperiment-derived classes defined in VanillaICE
  oligoSet <- oligoSet[chromosome(oligoSet) == 1, ]
  grl <- hmm(oligoSet, p.hom=0, TAUP=1e10, is.log=FALSE)
  g <- grl[[1]]

  ## To visualize each range in it's own panel surrounded by a
  ## frame of 2,000,000 bases:
  ## (here the frames are overlapping, but the method could be
  ## applied more generally to a collection of ranges from
  ## different chromsomes and samples)
  xyplot2(cn~x | range, data=oligoSet,
	       range=g,
	       frame=2e6, panel=xypanel,
	       cex=2,
	       pch=".",
	       col.het="salmon",
	       fill.het="salmon",
	       col.hom="royalblue",
	       fill.hom="royalblue",
	       state.cex=0.5,
	       border="orange", scales=list(x="free"),
	       par.strip.text=list(cex=0.5),
	       xlab="Mb", ylab=expression(log[2]("copy number")))
Results
R version 3.3.1 (2016-06-21) -- "Bug in Your Hair"
Copyright (C) 2016 The R Foundation for Statistical Computing
Platform: x86_64-pc-linux-gnu (64-bit)

R is free software and comes with ABSOLUTELY NO WARRANTY.
You are welcome to redistribute it under certain conditions.
Type 'license()' or 'licence()' for distribution details.

R is a collaborative project with many contributors.
Type 'contributors()' for more information and
'citation()' on how to cite R or R packages in publications.

Type 'demo()' for some demos, 'help()' for on-line help, or
'help.start()' for an HTML browser interface to help.
Type 'q()' to quit R.

> library(SNPchip)
Welcome to SNPchip version 2.18.0
> png(filename="/home/ddbj/snapshot/RGM3/R_BC/result/SNPchip/xyplot.Rd_%03d_medium.png", width=480, height=480)
> ### Name: xyplot
> ### Title: Plot copy number and physical position for a set of genomic
> ###   intervals.
> ### Aliases: xyplot2 xyplot2,formula,gSet-method
> ###   xyplot2,formula,SnpSet-method
> ### Keywords: dplot methods
>
> ### ** Examples
>
>   ## simulated data
>   library(oligoClasses)
Welcome to oligoClasses version 1.34.0
>   library(IRanges)
Loading required package: BiocGenerics
Loading required package: parallel

Attaching package: 'BiocGenerics'

The following objects are masked from 'package:parallel':

    clusterApply, clusterApplyLB, clusterCall, clusterEvalQ,
    clusterExport, clusterMap, parApply, parCapply, parLapply,
    parLapplyLB, parRapply, parSapply, parSapplyLB

The following objects are masked from 'package:stats':

    IQR, mad, xtabs

The following objects are masked from 'package:base':

    Filter, Find, Map, Position, Reduce, anyDuplicated, append,
    as.data.frame, cbind, colnames, do.call, duplicated, eval, evalq,
    get, grep, grepl, intersect, is.unsorted, lapply, lengths, mapply,
    match, mget, order, paste, pmax, pmax.int, pmin, pmin.int, rank,
    rbind, rownames, sapply, setdiff, sort, table, tapply, union,
    unique, unsplit

Loading required package: S4Vectors
Loading required package: stats4

Attaching package: 'S4Vectors'

The following objects are masked from 'package:base':

    colMeans, colSums, expand.grid, rowMeans, rowSums

>   library(VanillaICE)
Loading required package: GenomicRanges
Loading required package: GenomeInfoDb
Loading required package: SummarizedExperiment
Loading required package: Biobase
Welcome to Bioconductor

    Vignettes contain introductory material; view with
    'browseVignettes()'. To cite Bioconductor, see
    'citation("Biobase")', and for packages 'citation("pkgname")'.

Welcome to VanillaICE version 1.34.0
>   data(oligoSetExample, package="oligoClasses")
>   ## The oligoSnpSet class will likely be deprecated and made defunct
>   ## in a future release.  Instead, we favor
>   ## RangedSummarizedExperiment-derived classes defined in VanillaICE
>   oligoSet <- oligoSet[chromosome(oligoSet) == 1, ]
>   grl <- hmm(oligoSet, p.hom=0, TAUP=1e10, is.log=FALSE)
Warning message:
executing %dopar% sequentially: no parallel backend registered
>   g <- grl[[1]]
>
>   ## To visualize each range in it's own panel surrounded by a
>   ## frame of 2,000,000 bases:
>   ## (here the frames are overlapping, but the method could be
>   ## applied more generally to a collection of ranges from
>   ## different chromsomes and samples)
>   xyplot2(cn~x | range, data=oligoSet,
+ 	       range=g,
+ 	       frame=2e6, panel=xypanel,
+ 	       cex=2,
+ 	       pch=".",
+ 	       col.het="salmon",
+ 	       fill.het="salmon",
+ 	       col.hom="royalblue",
+ 	       fill.hom="royalblue",
+ 	       state.cex=0.5,
+ 	       border="orange", scales=list(x="free"),
+ 	       par.strip.text=list(cex=0.5),
+ 	       xlab="Mb", ylab=expression(log[2]("copy number")))
>
>
>
>
>
> dev.off()
null device
          1
>
|