Supported by Dr. Osamu Ogasawara and  . . |
|
Last data update: 2014.03.03 |
xyplot lattice function for RangedData and oligoSnpSet objectsDescriptionFor each genomic interval in the ranged data, a plot of the log R ratios and B allele frequencies stored in the oligoSnpSet are plotted. UsagexyplotLrrBaf(rd, object, frame, ...) Arguments
Details The ValueA Author(s)R. Scharpf See Also
Examples
library(crlmm)
library(SummarizedExperiment)
library(VanillaICE)
data(cnSetExample, package="crlmm")
oligoSetList <- BafLrrSetList(cnSetExample)
fit <- hmm(oligoSetList, p.hom=0)[[1]]
rd <- fit[sampleNames(fit)=="NA19007", ]
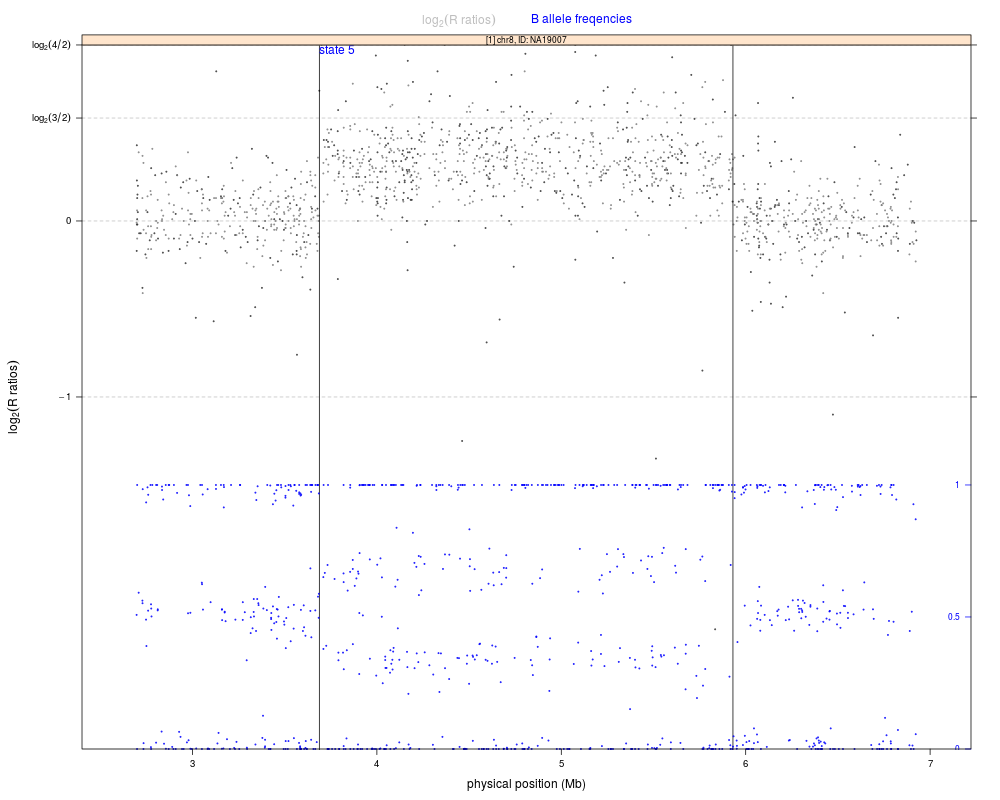
## We're interested in this range
range <- GRanges("chr8", IRanges(3.7e6, 5.9e6), sample="NA19007")
index <- subjectHits(findOverlaps(range, rd))
xyplotLrrBaf(rd[index, ], oligoSetList[[1]], frame=1e6,
panel=xypanelBaf, cex=0.2,
scales=list(x=list(relation="free"),
y=list(alternating=1,
at=c(-1, 0, log2(3/2), log2(4/2)),
labels=expression(-1, 0, log[2](3/2), log[2](4/2)))),
par.strip.text=list(cex=0.7),
ylim=c(-3,1),
col.hom="grey50",
col.het="grey50",
col.np="grey20",
xlab="physical position (Mb)",
ylab=expression(log[2]("R ratios")),
key=list(text=list(c(expression(log[2]("R ratios")), expression("B allele freqencies")),
col=c("grey", "blue")), columns=2))
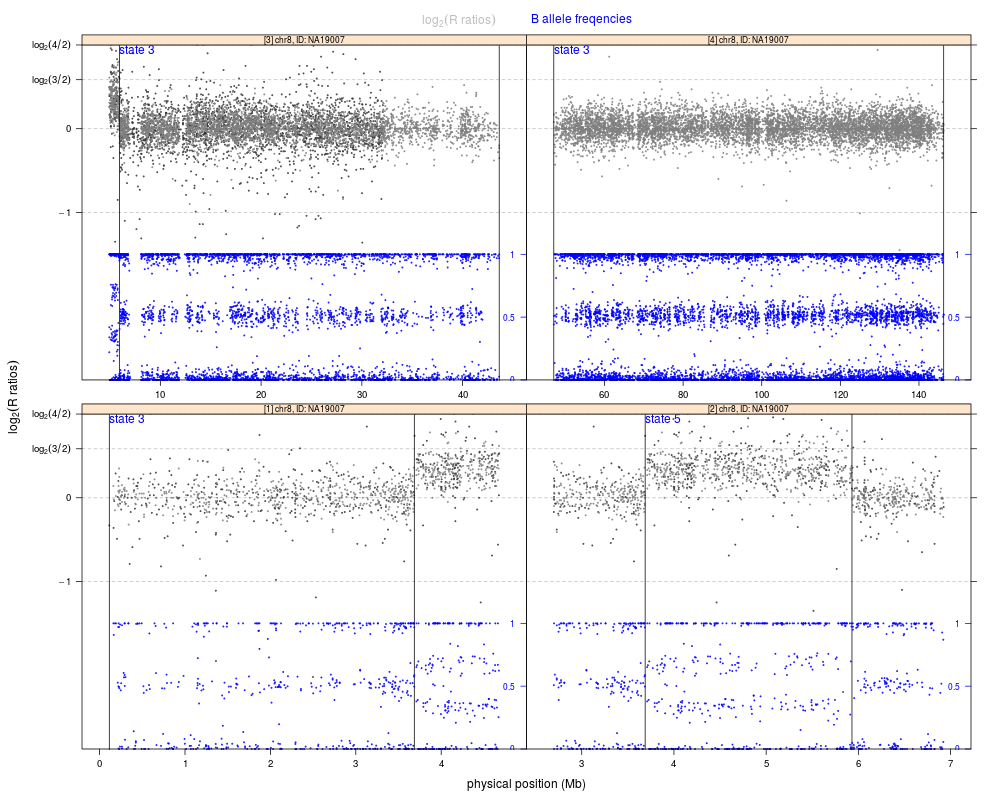
## Or, plot each range of the GRanges instance in a separate panel
xyplotLrrBaf(rd, oligoSetList[[1]], frame=1e6,
panel=xypanelBaf, cex=0.2,
scales=list(x=list(relation="free"),
y=list(alternating=1,
at=c(-1, 0, log2(3/2), log2(4/2)),
labels=expression(-1, 0, log[2](3/2), log[2](4/2)))),
par.strip.text=list(cex=0.7),
ylim=c(-3,1),
col.hom="grey50",
col.het="grey50",
col.np="grey20",
xlab="physical position (Mb)",
ylab=expression(log[2]("R ratios")),
key=list(text=list(c(expression(log[2]("R ratios")), expression("B allele freqencies")),
col=c("grey", "blue")), columns=2))
Results
R version 3.3.1 (2016-06-21) -- "Bug in Your Hair"
Copyright (C) 2016 The R Foundation for Statistical Computing
Platform: x86_64-pc-linux-gnu (64-bit)

R is free software and comes with ABSOLUTELY NO WARRANTY.
You are welcome to redistribute it under certain conditions.
Type 'license()' or 'licence()' for distribution details.

R is a collaborative project with many contributors.
Type 'contributors()' for more information and
'citation()' on how to cite R or R packages in publications.

Type 'demo()' for some demos, 'help()' for on-line help, or
'help.start()' for an HTML browser interface to help.
Type 'q()' to quit R.

> library(SNPchip)
Welcome to SNPchip version 2.18.0
> png(filename="/home/ddbj/snapshot/RGM3/R_BC/result/SNPchip/xyplotLrrBaf.Rd_%03d_medium.png", width=480, height=480)
> ### Name: xyplotLrrBaf
> ### Title: xyplot lattice function for RangedData and oligoSnpSet objects
> ### Aliases: xyplotLrrBaf
> ### Keywords: hplot
>
> ### ** Examples
>
> library(crlmm)
Loading required package: oligoClasses
Welcome to oligoClasses version 1.34.0
Loading required package: preprocessCore
Welcome to crlmm version 1.30.0
> library(SummarizedExperiment)
Loading required package: GenomicRanges
Loading required package: BiocGenerics
Loading required package: parallel

Attaching package: 'BiocGenerics'

The following objects are masked from 'package:parallel':

    clusterApply, clusterApplyLB, clusterCall, clusterEvalQ,
    clusterExport, clusterMap, parApply, parCapply, parLapply,
    parLapplyLB, parRapply, parSapply, parSapplyLB

The following objects are masked from 'package:stats':

    IQR, mad, xtabs

The following objects are masked from 'package:base':

    Filter, Find, Map, Position, Reduce, anyDuplicated, append,
    as.data.frame, cbind, colnames, do.call, duplicated, eval, evalq,
    get, grep, grepl, intersect, is.unsorted, lapply, lengths, mapply,
    match, mget, order, paste, pmax, pmax.int, pmin, pmin.int, rank,
    rbind, rownames, sapply, setdiff, sort, table, tapply, union,
    unique, unsplit

Loading required package: S4Vectors
Loading required package: stats4

Attaching package: 'S4Vectors'

The following objects are masked from 'package:base':

    colMeans, colSums, expand.grid, rowMeans, rowSums

Loading required package: IRanges
Loading required package: GenomeInfoDb
Loading required package: Biobase
Welcome to Bioconductor

    Vignettes contain introductory material; view with
    'browseVignettes()'. To cite Bioconductor, see
    'citation("Biobase")', and for packages 'citation("pkgname")'.

> library(VanillaICE)
Welcome to VanillaICE version 1.34.0

Attaching package: 'VanillaICE'

The following object is masked from 'package:crlmm':

    genotypes

> data(cnSetExample, package="crlmm")
> oligoSetList <- BafLrrSetList(cnSetExample)
Warning message:
executing %dopar% sequentially: no parallel backend registered
> fit <- hmm(oligoSetList, p.hom=0)[[1]]
> rd <- fit[sampleNames(fit)=="NA19007", ]
> ## We're interested in this range
> range <- GRanges("chr8", IRanges(3.7e6, 5.9e6), sample="NA19007")
> index <- subjectHits(findOverlaps(range, rd))
> xyplotLrrBaf(rd[index, ], oligoSetList[[1]], frame=1e6,
+ 	     panel=xypanelBaf, cex=0.2,
+ 	     scales=list(x=list(relation="free"),
+ 	     y=list(alternating=1,
+ 	     at=c(-1, 0, log2(3/2), log2(4/2)),
+ 	     labels=expression(-1, 0, log[2](3/2), log[2](4/2)))),
+ 	     par.strip.text=list(cex=0.7),
+ 	     ylim=c(-3,1),
+ 	     col.hom="grey50",
+ 	     col.het="grey50",
+ 	     col.np="grey20",
+ 	     xlab="physical position (Mb)",
+ 	     ylab=expression(log[2]("R ratios")),
+ 	     key=list(text=list(c(expression(log[2]("R ratios")), expression("B allele freqencies")),
+ 		      col=c("grey", "blue")), columns=2))
>
> ## Or, plot each range of the GRanges instance in a separate panel
> xyplotLrrBaf(rd, oligoSetList[[1]], frame=1e6,
+ 	     panel=xypanelBaf, cex=0.2,
+ 	     scales=list(x=list(relation="free"),
+ 	     y=list(alternating=1,
+ 	     at=c(-1, 0, log2(3/2), log2(4/2)),
+ 	     labels=expression(-1, 0, log[2](3/2), log[2](4/2)))),
+ 	     par.strip.text=list(cex=0.7),
+ 	     ylim=c(-3,1),
+ 	     col.hom="grey50",
+ 	     col.het="grey50",
+ 	     col.np="grey20",
+ 	     xlab="physical position (Mb)",
+ 	     ylab=expression(log[2]("R ratios")),
+ 	     key=list(text=list(c(expression(log[2]("R ratios")), expression("B allele freqencies")),
+ 		      col=c("grey", "blue")), columns=2))
>
>
>
>
>
>
> dev.off()
null device
          1
>
|
Created & Maintained by Osamu Ogasawara (osamu.ogasawara@gmail.com) and 