R: Visualize the results of the allelic bias analysis across...
plotAllelicBiasResultsOverview
R Documentation
Visualize the results of the allelic bias analysis across regions or a user-defined genomic range
Description
plotBinCounts visualizes the results of the allelic bias analysis across regions or a user-defined genomic range.
Note that only the results of a particular chromosome can be visualized. It is therefore only possible if the regions to be visualized
are located on one particular chromosome; otherwise, an error is thrown.
Numeric or Character or NULL. Default NULL. Regions that should be plotted, either specified as integer (such as 1, value must be
between 1 and the total number of regions as defined in the object) or their annotation (name must appear in the region names as obtained via the function annotationRegions). If set to NULL, all regions will be considered.
datasets
Numeric or Character or NULL. Default NULL. Datasets that should be used for plotting, either specified as integer (such as 1, value must be
between 1 and the total number of datasets as defined in the object) or their annotation (name must appear in the dataset names as obtained via the function annotationDatasets). If set to NULL, all datasets will be considered.
plotChr
Character(1) or NULL. Default NULL. The name of the chromosome for which the visualization should be done. Must be a valid chromosome name.
If set to NULL, other parameters (such asregions) determine which genomic region should be plotted.
plotStartPos
Character(1) or NULL. Default NULL. The start coordinates for which the visualization should be done. Must be a valid number with respect to the chromosome it refers to. If set to NULL and the parameter plotChr is not NULL, the start coordinates are set to 1.
plotEndPos
Character(1) or NULL. Default NULL. The end coordinates for which the visualization should be done. Must be a valid number with respect to the chromosome it refers to. If set to NULL and the parameter plotChr is not NULL, the end coordinates are determined automatically and the full chromosome will be plotted.
ylim
Numeric(2). Default NULL. Range of the y-axis, as specified by a minimum and a maximum value. See ?ylim for details.
plotRegionBoundaries
Logical(1). Default FALSE. Should the region boundaries be drawn in the plot? If set to TRUE, two vertical lines will be drawn for each region, corresponding to the region boundaries upstream and downstream of the SNP. This visual aid may help to judge the size of the regions and overlaps among regions.
plotRegionLabels
Logical(1). Should the annotation of the regions be drawn vertically below the x axis? If many regions are plotted,
labels may overlap; however, for a few regions, this is usually not a problem.
signThreshold
Numeric(1). Default 0.05. The significance threshold (such as p-value or FDR threshold). Must be between 0 and 1. If the parameter belongs to a plotting function, a horizontal line is drawn at the chosen value. For the allelic bias summary plots, p-values below this threshold and the corresponding allelic fractions are highlighted.
pValueSummary
Character(1). Default "min". Either "min" or "median". If set to "min", for each region, the minimum p-value across all bins
is displayed as a representative result for the region. This is in analogy to how the background caclulation for the FDR calculation works,
see the vignette for details. If set to "median", the median p-value is calculated for each region and plotted. This may facilitate to identify
regions for which a lot of bins have low p-values.
maxWidthLabels
Numeric(1). Default NULL. Maximum width of the legend labels in number of characters.
If the width of the legend labels are longer, they are shortened. Set to NULL to not shorten labels.
colorPalette
Character(1). Default "Set1". Name of the palette from the RColorBrewer package from the qualitative palettes
for the colors of the datasets that are plotted.
Allowed palette names are "Accent", "Dark2", "Paired", "Pastel1", "Pastel2", "Set1", "Set2", and "Set3". Colors for the datasets are
then determined automatically from the given palette name (from left to right, depending on the number of datasets to be plotted).
The colors for the read groups within each datasets are based on the colors for the dataset, but with different saturation values.
sizePoints
Numeric(1). Default 4. Size of the points that are drawn in the plot (if type is set to the default value of "p").
This parameter has no effect if type is set to "l".
plotGraph
Logical(1). Default TRUE. Should the graphs be plotted to the current graphics device?
fileToPlot
Character(1) or NULL. Default NULL.
Filename of the PDF file for the output plots.
If set to NULL, plots will be plotted to the currently active device.
verbose
Logical(1). Default FALSE. Should the verbose mode (i.e., diagnostic messages during execution of the script) be enabled?
Value
the generated ggplot2 plot(s) as list for further processing. May contain multiple plots, depending on the function. The plot(s) can then be plotted individually or modified arbitrarily as the user wants. For example, if multiple plots are returned and the plots have been saved in a variable called plots.l, simply type plots.l[[1]] to view the first plot.
Examples
data(SNPhood.o, package="SNPhood")
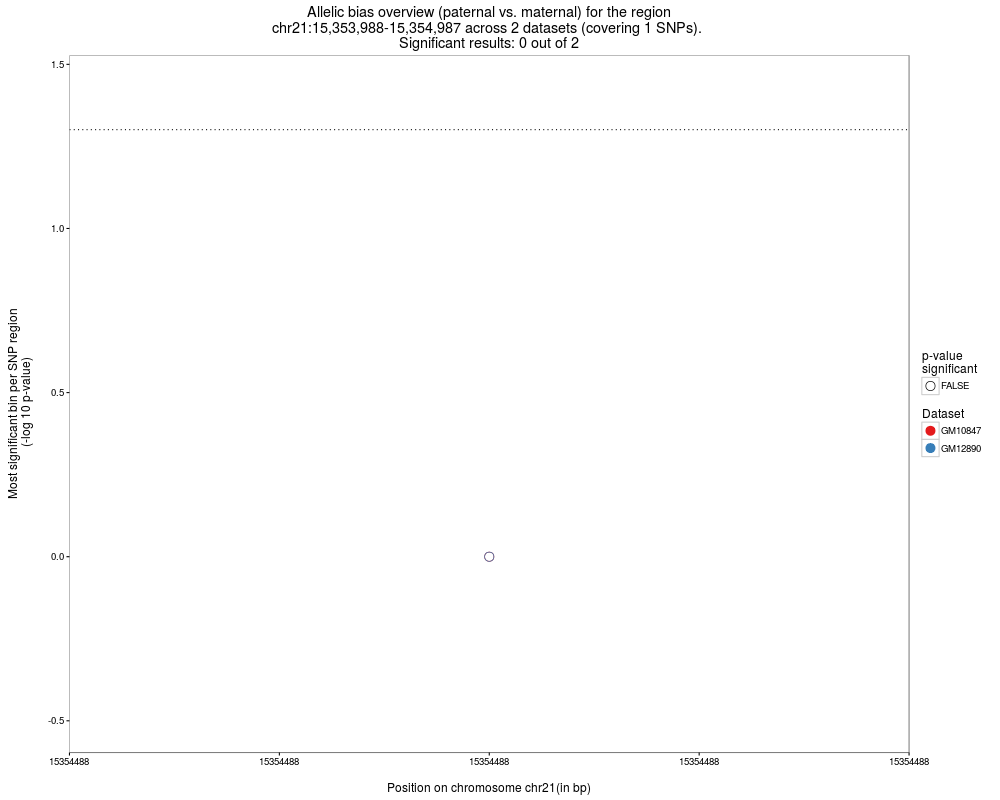
# Plot the allelic bias results for the first region using default values for all parameters
plots = plotAllelicBiasResultsOverview(SNPhood.o)
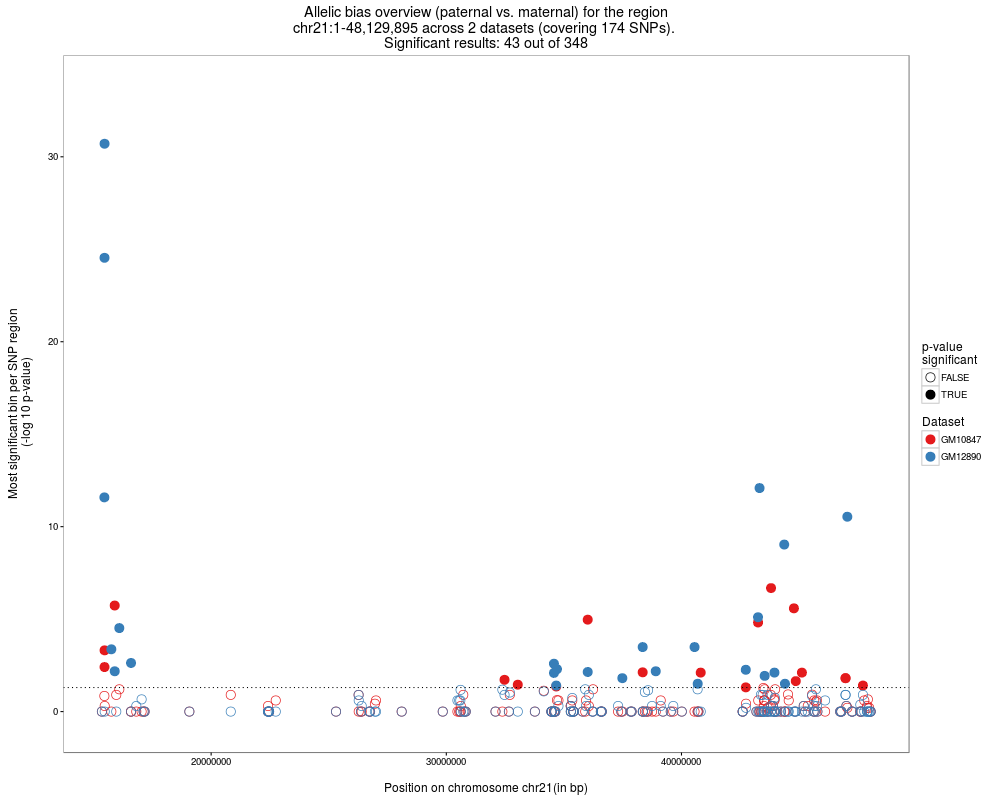
# Plot the allelic bias results for the full chr21
plots = plotAllelicBiasResultsOverview(SNPhood.o, regions = NULL, plotChr = "chr21")
Results
R version 3.3.1 (2016-06-21) -- "Bug in Your Hair"
Copyright (C) 2016 The R Foundation for Statistical Computing
Platform: x86_64-pc-linux-gnu (64-bit)

R is free software and comes with ABSOLUTELY NO WARRANTY.
You are welcome to redistribute it under certain conditions.
Type 'license()' or 'licence()' for distribution details.

R is a collaborative project with many contributors.
Type 'contributors()' for more information and
'citation()' on how to cite R or R packages in publications.

Type 'demo()' for some demos, 'help()' for on-line help, or
'help.start()' for an HTML browser interface to help.
Type 'q()' to quit R.

> library(SNPhood)
Loading required package: GenomicRanges
Loading required package: BiocGenerics
Loading required package: parallel

Attaching package: 'BiocGenerics'

The following objects are masked from 'package:parallel':

    clusterApply, clusterApplyLB, clusterCall, clusterEvalQ,
    clusterExport, clusterMap, parApply, parCapply, parLapply,
    parLapplyLB, parRapply, parSapply, parSapplyLB

The following objects are masked from 'package:stats':

    IQR, mad, xtabs

The following objects are masked from 'package:base':

    Filter, Find, Map, Position, Reduce, anyDuplicated, append,
    as.data.frame, cbind, colnames, do.call, duplicated, eval, evalq,
    get, grep, grepl, intersect, is.unsorted, lapply, lengths, mapply,
    match, mget, order, paste, pmax, pmax.int, pmin, pmin.int, rank,
    rbind, rownames, sapply, setdiff, sort, table, tapply, union,
    unique, unsplit

Loading required package: S4Vectors
Loading required package: stats4

Attaching package: 'S4Vectors'

The following objects are masked from 'package:base':

    colMeans, colSums, expand.grid, rowMeans, rowSums

Loading required package: IRanges
Loading required package: GenomeInfoDb
Loading required package: Rsamtools
Loading required package: Biostrings
Loading required package: XVector
Loading required package: data.table

Attaching package: 'data.table'

The following object is masked from 'package:GenomicRanges':

    shift

The following object is masked from 'package:IRanges':

    shift

Loading required package: checkmate

------------------------------------------------------------------------------------------------------------------
|       Welcome to the SNPhood package and thank you for using our software. This is SNPhood version 1.2.2.      |
| See the vignettes (type browseVignettes("SNPhood") or the help pages for how to use SNPhood for your analyses. |
|       Thank you for using our software. Please do not hesitate to contact us if there are any questions.       |
------------------------------------------------------------------------------------------------------------------

> png(filename="/home/ddbj/snapshot/RGM3/R_BC/result/SNPhood/plotAllelicBiasResultsOverview.Rd_%03d_medium.png", width=480, height=480)
> ### Name: plotAllelicBiasResultsOverview
> ### Title: Visualize the results of the allelic bias analysis across
> ###   regions or a user-defined genomic range
> ### Aliases: plotAllelicBiasResultsOverview
>
> ### ** Examples
>
> data(SNPhood.o, package="SNPhood")
>
> # Plot the allelic bias results for the first region using default values for all parameters
> plots = plotAllelicBiasResultsOverview(SNPhood.o)
>
> # Plot the allelic bias results for the full chr21
> plots = plotAllelicBiasResultsOverview(SNPhood.o, regions = NULL, plotChr = "chr21")
>
>
>
>
>
>
> dev.off()
null device
          1
>
 .
.